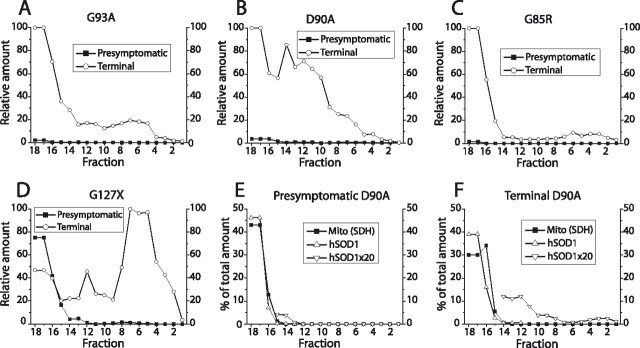
Figure 4.
Detection of hSOD1 aggregates in density gradient separations of spinal cord homogenates from presymptomatic and terminally ill mice, as indicated by the framed insets and in the figures. In each figure, the largest amount of aggregates found in a fraction was set to 100, and the results for all other fractions have been presented relative to that. A–D, Filter trap assay for hSOD1 aggregates. E, F, Filtrates of spinal cord extracts were treated with 0.5% of the detergent NP-40 and sonicated before density gradient ultracentrifugation. SDH and hSOD1 were analyzed in the tapped fractions. Mito (SDH), The mitochondrial marker SDH.

