
Figure 1.
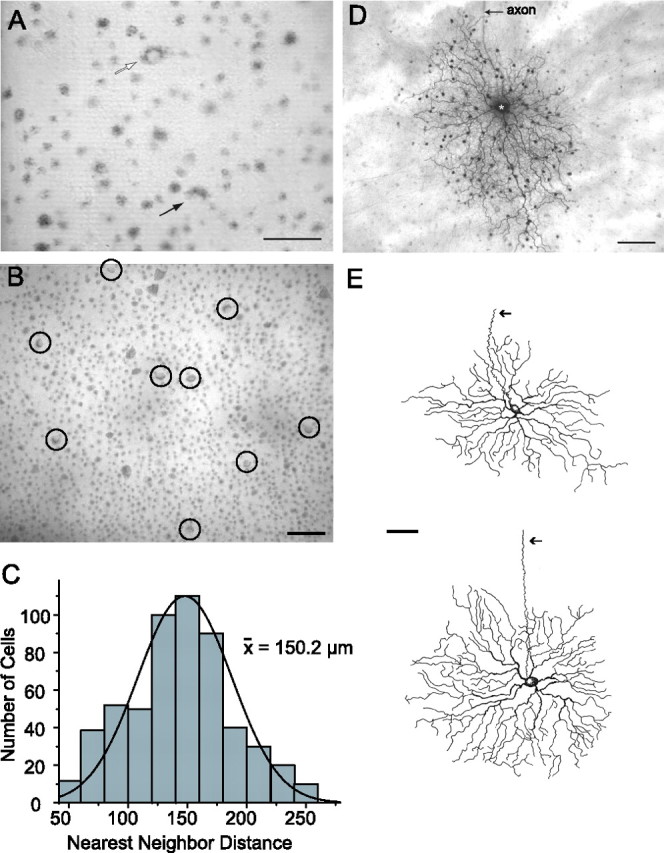
Crescent-shaped ganglion cells form a regular mosaic that can be easily targeted for recording and labeling. A, Digital video image of the living flattened retinal–scleral preparation during an experiment. Ganglion cells with relatively large somata are easily visualized after Azure B labeling, including the α cells (open arrow). The crescent-shaped cells can be easily identified by their characteristic labeling pattern (closed arrow). Scale bar, 50 μm. B, Digital video image showing an array of crescent ganglion cells (circled) in the visual streak region. Scale bar, 50 μm. C, Histogram of nearest-neighbor distances between the somata of crescent ganglion cells within the visual streak region. The solid line is a Gaussian fit to the data. The average distance between crescent cells in the visual streak was 150 μm. D, Photomicrograph showing the complete morphology of a crescent cell labeled with Neurobiotin at an eccentricity of 1.8 mm from the optic disk. This cell shows a stereotypic asymmetric dendritic field and coupling to an array of amacrine cells that exhibit relatively small somata. Long axon-like processes of the amacrine cells can be seen extending beyond the field of view. Scale bar, 50 μm. E, Camera lucida drawings of Neurobiotin-labeled crescent cells showing variation in morphology with eccentricity. Cell eccentricities were 2.2 and 3.2 mm, respectively, from the optic disk. The arrows indicate an axon. Scale bar, 50 μm.