
Figure 4.
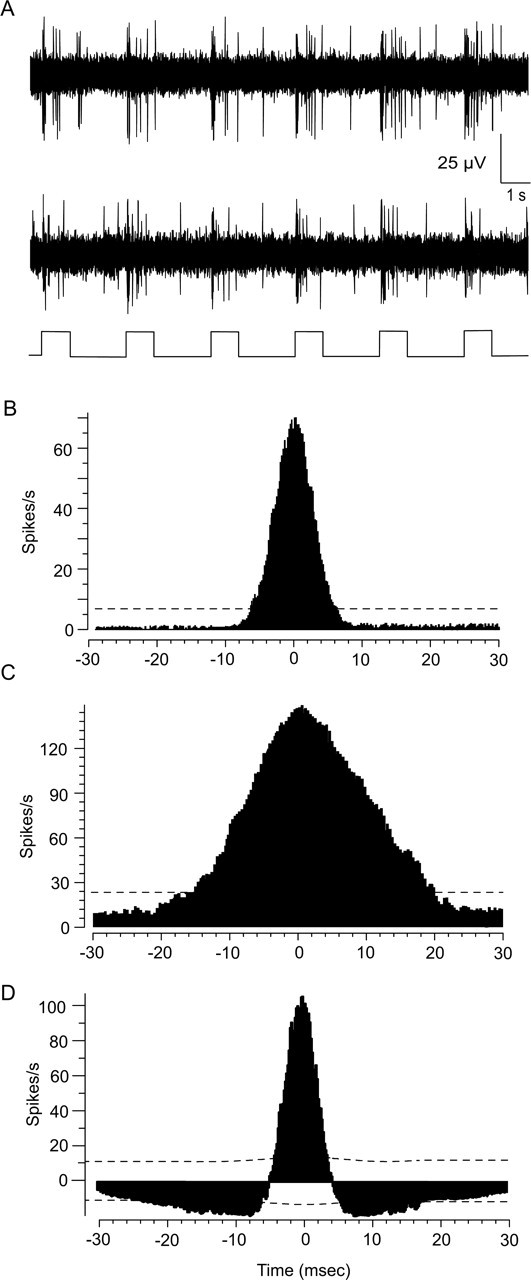
Cross-correlation functions for spontaneous and light-evoked spiking of neighboring ON DS ganglion cells. A, Light-evoked responses of two ON DS ganglion cells recorded simultaneously. The trace at the bottom of the panel indicates the onset and offset of the full-field stimuli. B, Cross-correlogram of the spontaneous activity between a neighboring pair of ON DS cells recorded simultaneously. Distribution shows a narrow profile with peak at time 0. The dashed line is the 99% confidence limit. C, Cross-correlogram of the light-evoked spikes of the same cell pair in response to a stationary full-field stimulus. Distribution also shows a single peak at time 0, but is broader than that for spontaneous spikes. D, Shift predictor analysis of the light-evoked spikes shown in C eliminates correlations attributable to the light stimulus. After analysis, the profile still maintains a single peak at time 0, but is narrower, closely matching the cross-correlogram for spontaneous spikes. These data suggest that light-evoked concerted spiking is reflected by the broader profile component, whereas light-independent spike synchrony is reflected by the narrow component.