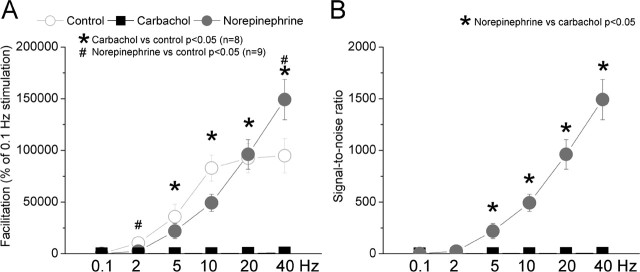
Figure 6.
Population data showing the effects of cholinergic and noradrenergic activation on facilitation and signal-to-noise ratios for corticothalamic responses. A, Comparison of the amount of facilitation between the different conditions. Facilitation for responses at different frequencies was calculated as the percentage of responses at 0.1 Hz. The responses were measured by summing the spikes evoked during a 20 ms time window after the thalamic radiation stimulus during control conditions and during application of carbachol or norepinephrine. The control group (n = 17) resulted from averaging the control responses of cells subjected to carbachol and norepinephrine for illustration purposes. However, statistical calculations were performed within subjects by comparing the effect of each drug with its control responses. B, Comparison of signal-to-noise ratios for corticothalamic responses at different frequencies. Statistical calculations were performed between subjects by comparing the effect of norepinephrine versus the effect of carbachol. Note the much larger signal-to-noise ratios during noradrenergic activation.

