
Figure 5.
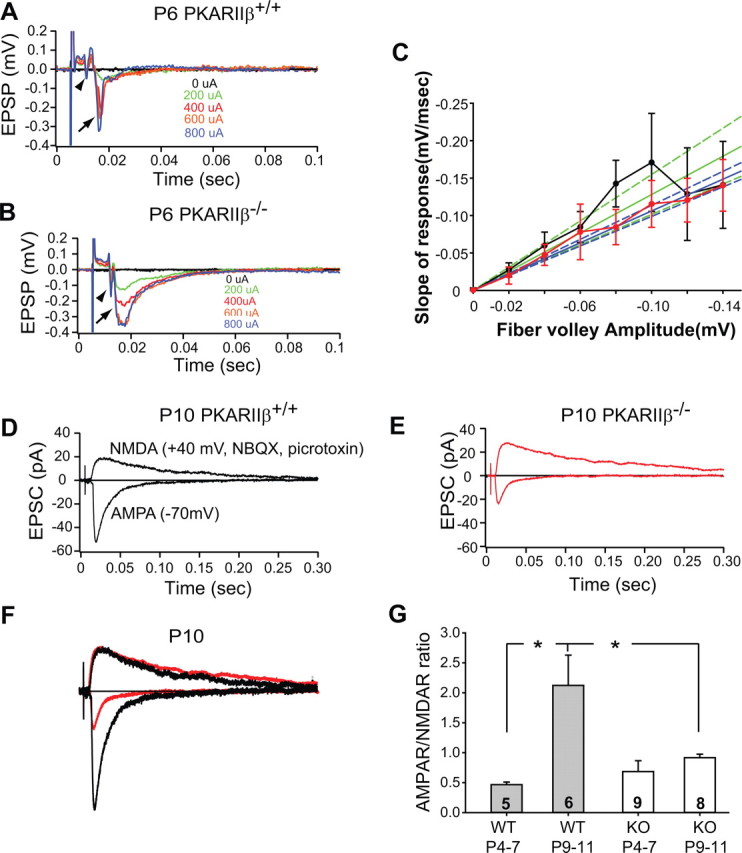
Developmental increase in AMPAR/NMDAR current ratio is absent in PKARIIβ−/− mice. A–C, Input–output analyses of extracellular field potential recordings indicate no difference in gross synaptic transmission between wild-type and PKARIIβ−/− thalamocortical synapses. A, B, Sample average responses at different stimulation strengths of P6 wild-type and PKARIIβ−/− mice. The arrowhead shows the fiber volley, and the arrow shows the postsynaptic response. C, Input–output curves in wild-type (black; n = 8) and PKARIIβ−/− (red; n = 4) mice at P6–P7 are similar. Regression analysis for wild types (green) and PKARIIβ−/− (blue) show no significant difference at 95% confidence interval (dashed lines overlap). D–F, Sample whole-cell voltage-clamp measurements of AMPAR-mediated and NMDAR-mediated thalamocortical EPSCs in a P10 wild-type littermate control (D) and P10 PKARIIβ−/− (E) mouse. F, Overlay of the responses in D and E scaled so that the NMDAR currents are the same amplitude. Note the AMPAR-mediated EPSC in PKARIIβ−/− animal is small in comparison to the littermate control. G, Summary quantification of AMPAR/NMDAR current ratios for different age groups and different genotypes. The AMPAR/NMDAR current ratio of wild-type animals increases significantly with age (*p < 0.05; t test). However, this increase is absent in PKARIIβ−/− (KO) mice (p = 0.27; t test). The AMPAR/NMDAR current ratio of P9–P11 PKARIIβ−/− mice is also significantly lower than that of P9–P11 wild-type (WT) littermate controls (*p < 0.05; t test). Error bars indicate SEM.