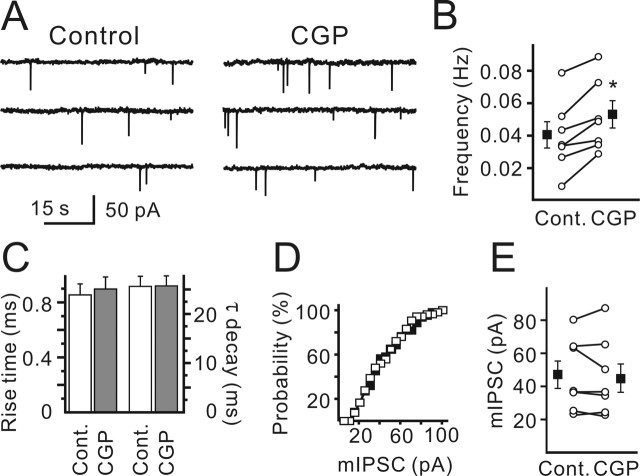
Figure 2.
GABABR blockade increased mIPSC frequency but did not affect the median mIPSC amplitude. A, Sample traces show mIPSCs recorded in the control and in the presence of CGP55845. B, Statistical data show CGP55845-induced increase in mIPSC frequency. Open symbols represent mean values obtained for each cell in the control and in the presence of CGP55845. Filled symbols represent the mean values (n = 7). ∗p < 0.05. C, CGP55845 did not change mIPSC rise time (10–90%) and decay kinetics. Data were obtained from seven CR cells. D, mIPSC amplitude distribution was not affected by CGP55845 (filled symbols). The plot represents data obtained from a single CR cell. E, CGP55845 did not change the median mIPSC amplitude. Open symbols represent values obtained for each cell in the control and in the presence of CGP55845. Filled symbols represent the mean values (n = 7). Error bars indicate SEM. CGP, CGP55845; Cont., control.

