
Figure 3.
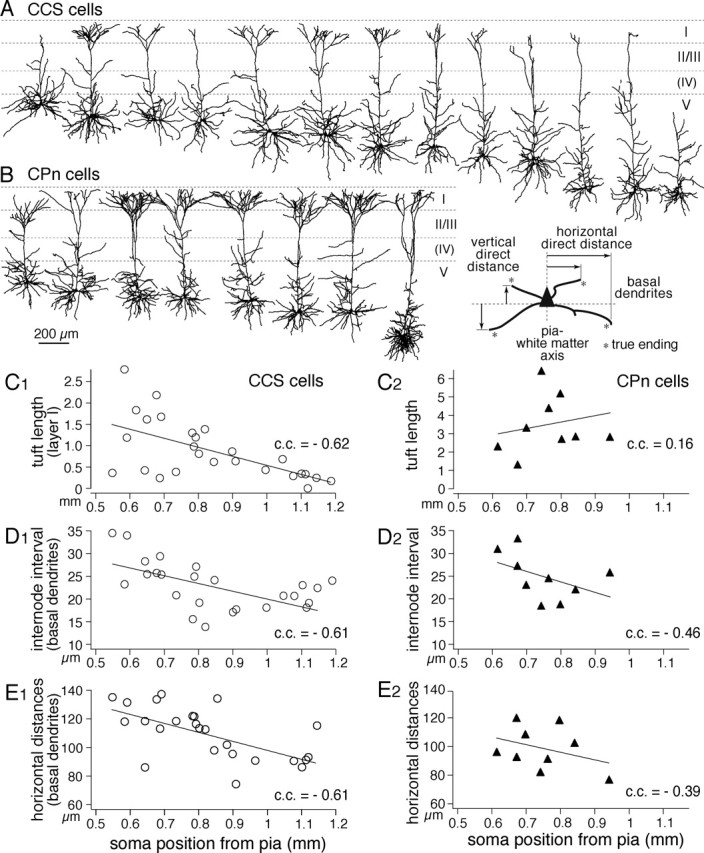
Depth dependency of dendritic morphologies among CCS cells. A, B, Dendritic reconstructions of CCS cells (top) and CPn cells (bottom), arranged from most superficial to deeper somata in layer V. C–E, Depth profiles of dendritic lengths in layer I (C), mean internode intervals of basal dendrites (D), and horizontal direct distances of basal dendrite endings (E) (inset defines the parameters of endings). Note the depth dependency of these parameters in CCS cells. Lines are linear fits.