
Figure 1.
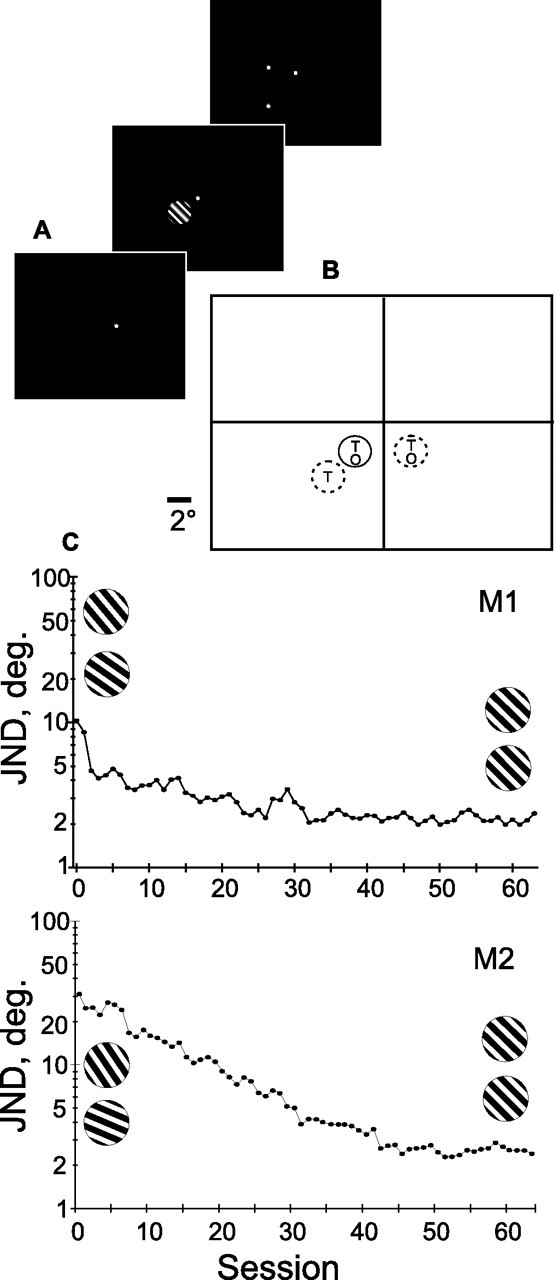
A, Training regimen. Subject fixated on a central red spot for 300 ms, followed by a 300 ms presentation of the stimulus. The stimulus then disappeared and the subject indicated the orientation by a saccade to one of the two target spots. B, Display screen and position of stimulus during training and behavioral testing. Solid outline, Trained and tested position. Dotted outline, Behavioral testing only. Letters “T” and “O” indicate where trained or orthogonal orientations were tested. The line segment at the lower left indicates scale. C, Staircase procedure training of monkeys 1 and 2. Each point is the average of all reversals for a daily session, which tends to be higher than the actual threshold. The orientations used in the testing in the first and last sessions are shown in inset: 130° compared with 140° and 134° compared with 136° for M1; and 119° compared with 151° and 134° compared with 136° for M2.