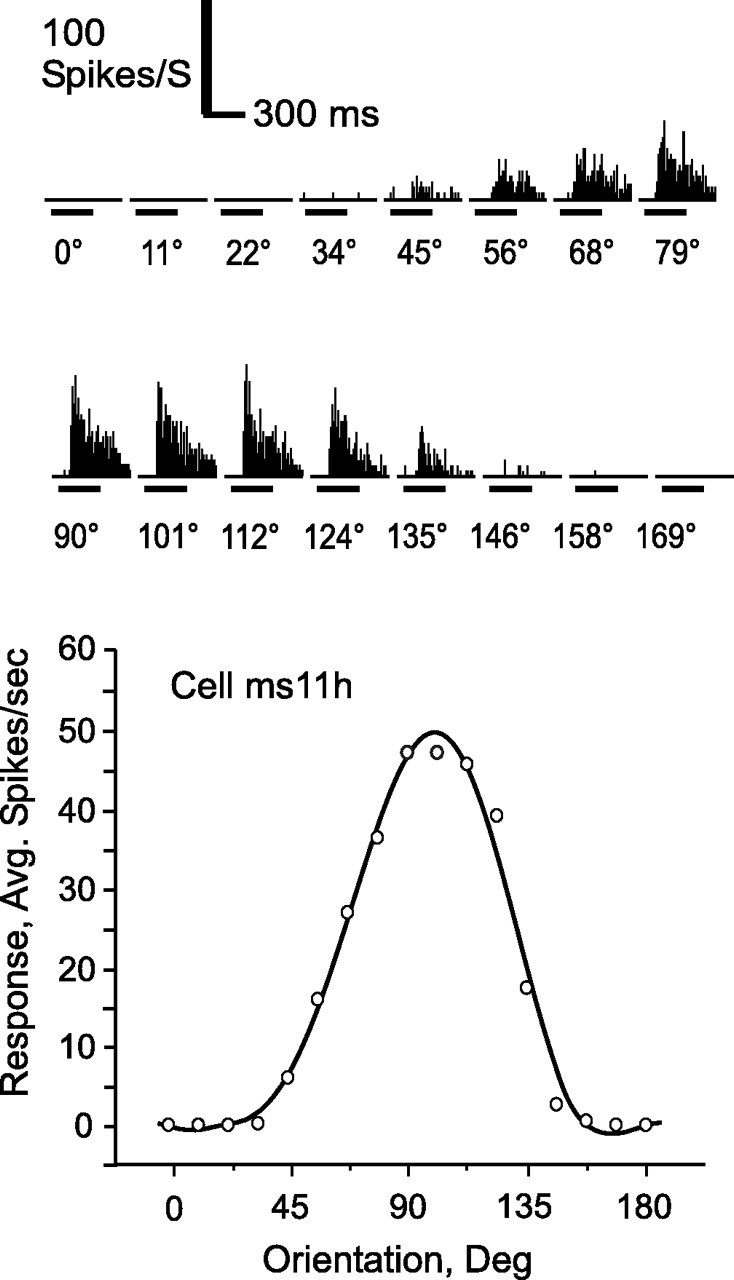
Figure 2.

Response to grating stimulus in typical V4 cell. Histograms (above) show cumulative responses to the 16 tested orientations. Time course and strength of responses are indicated by the scale. The lower panel shows the same data, calculated as average absolute firing rate, recentered, and fit with polynomial curve. By definition, 0° is horizontal.
