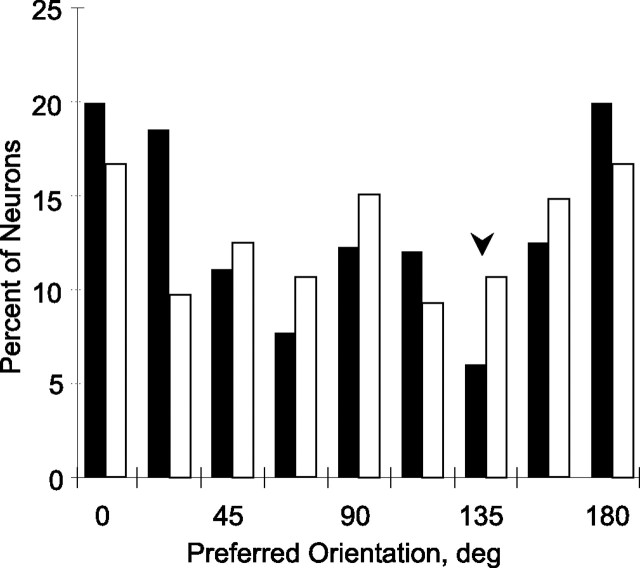
Figure 5.
Histogram of preferred orientations in all V4 neurons giving significant response, effect of orientation, and polynomial fit (n = 416 and 429 for trained and control neurons, respectively). Filled bars, Trained neurons; open bars, control. The arrow shows the position of trained orientation. The distribution of the trained population differs significantly from a uniform distribution (p < 10−6, K–S), which was not the case in the control population (p > 0.10).

