
Figure 9.
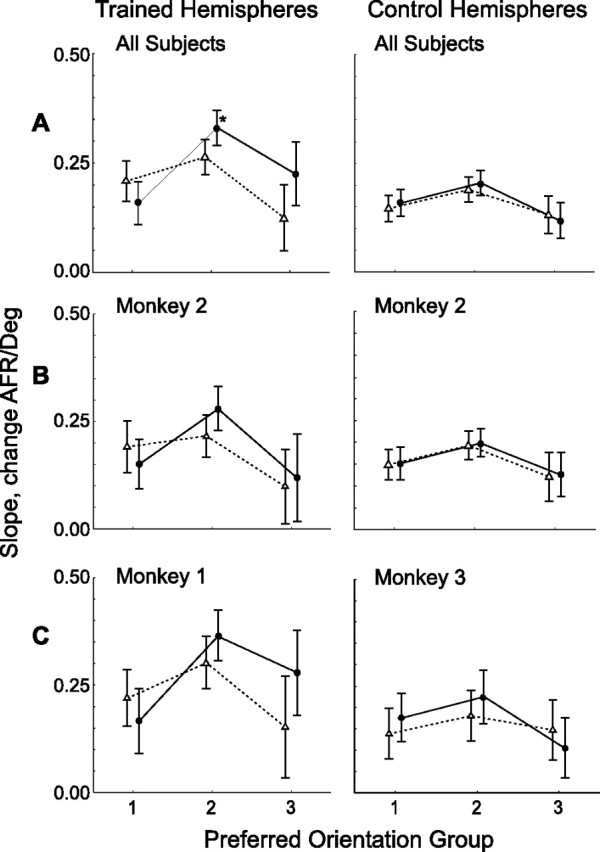
Slope of tuning curves at trained (solid lines; filled circles) and orthogonal (dotted lines; open triangles) orientation plotted as a function of preferred orientation groups, relative to reference orientation (trained or orthogonal orientation). Trained and control hemispheres, Plotted left and right columns, respectively. A, Overall populations. Shown are the same populations as in Figure 6. B, Monkey M2; C, monkeys M1 and M3. Neurons were grouped according to their preferred orientation, determined by circular statistical methods, and average slope was calculated for each orientation group. Error bars are 95% confidence intervals. Group 0, Preferred orientation 0–33° from reference; group 1, 34–67° from reference; and group 2, 68–90° from reference. Asterisk indicates conditions significant in post hoc analysis (Fisher's LSD, <0.05). AFR, Average firing rate.