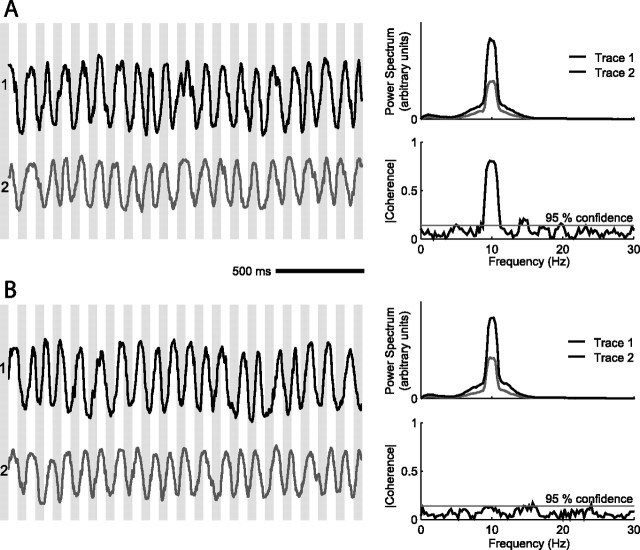
Figure 1.
Illustration of coherence measurement between two rhythmic traces. The time series are based on simulated data that consist of sinusoids with added Gaussian amplitude noise, whose correlation time is 160 ms and SD is 30% of the sinusoidal amplitude and added Gaussian phase noise, also with a 160 ms correlation time. The two time series have the same frequency but are modulated in frequency from trial to trial (f = 10.0 ± 0.3 Hz). A, The two time series co-drift; the bands on the left are to guide the eye. The top right trace shows the two average power spectra of 50 samples, and the bottom right trace is the magnitude of average coherence, which is high in the region of substantial overlap of the power spectra. The gray horizontal line represents the magnitude for which the coherence is significant at p < 0.05. B, The two time series drift independently. The peaks in the two power spectra overlap substantially, as shown in the top right panel, but the magnitude of the coherence is low and insignificant at the overlap in frequency.

