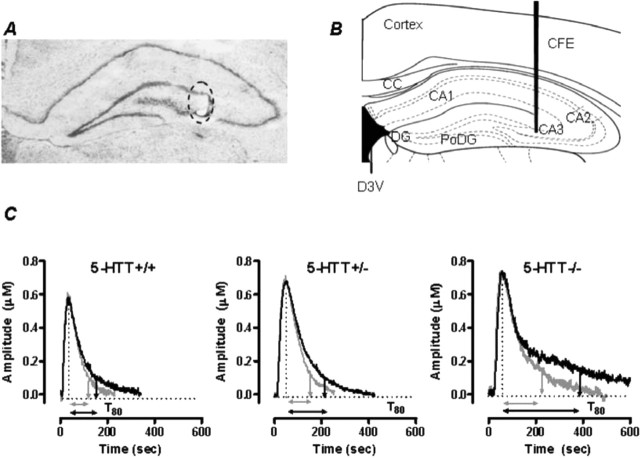
Figure 1.
Electrode placement and signals produced by pressure ejection of 5-HT into the CA3 region of hippocampus. A, Thionin-stained coronal section showing the mouse hippocampus at the level of plate 47 (Franklin and Paxinos, 1997). The circled area shows the electrolytic lesion made to mark the placement of the active recording area of the carbon fiber electrode in the CA3 region of the hippocampus. Note the minimal tissue damage created by the electrode tract. B, Plate 47 adapted from Franklin and Paxinos showing recording site within the CA3 region of mouse hippocampus. C, Representative oxidation currents (converted to micromolar values) produced by pressure ejection of 5-HT into the hippocampus before (gray line) and 2 min after ethanol (10 nmol) treatment in 5-HTT+/+, +/−, and −/− mice. Raw tracings are superimposed for ease of comparison. Note the marked increase in T80 in 5-HTT−/− mice compared with 5-HTT+/+ and 5-HTT+/− mice. CFE, Carbon fiber electrode; CC, corpus callosum; D3V, dorsal third ventricle; DG, dentate gyrus; PoDG, polymorph layer of dentate gyrus; CA1, CA2, and CA3, regions of hippocampus.

