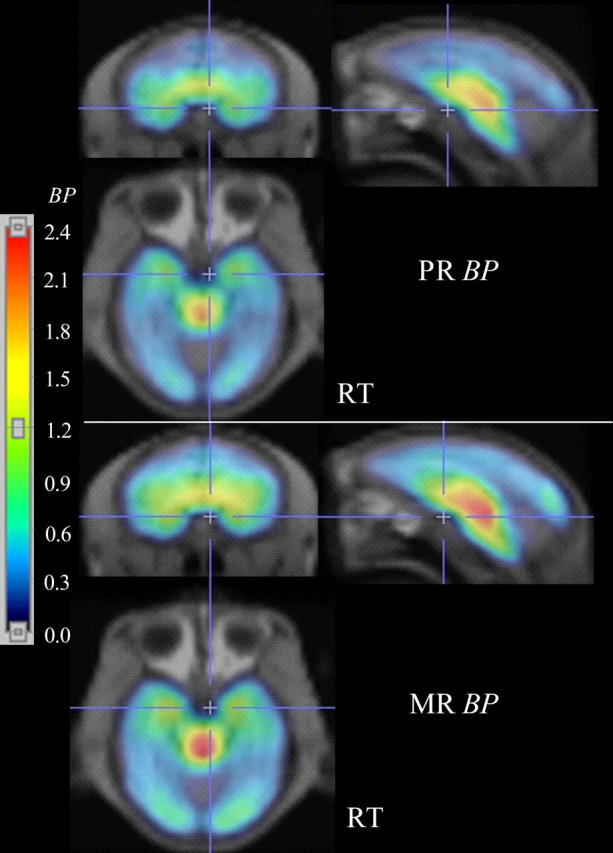
Figure 1.

Spatially normalized parametric images of SERT BP fused onto the rhesus MRI template. BP images are shown in color, whereas the template MRIs are shown in grayscale. One PR monkey and one MR monkey are shown, respectively, in the top two rows and bottom two lower separated by a horizontal white line. For each monkey, coronal (top left), sagittal (top right), and transaxial (bottom left) slices are shown. The color scale on the left represents the range of BP values from 0 to 2.4. RT, Right.
