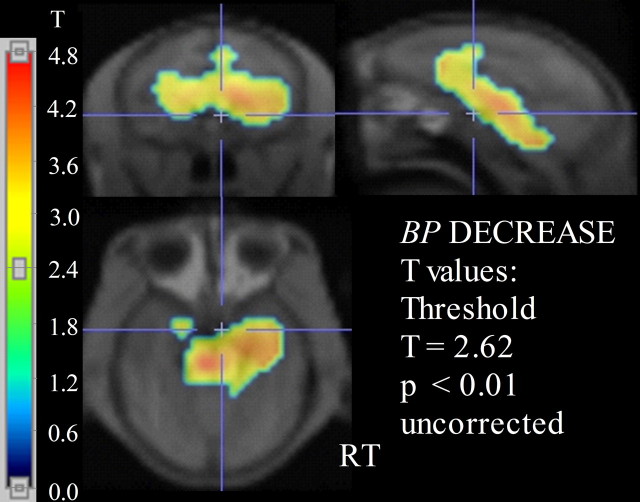
Figure 2.
Voxelwise comparison of SERT BP between PR and MR rhesus monkeys by SPM2. The panels show coronal (left top), sagittal (right top), and axial (left bottom) views of the rhesus MRI template represented in grayscale, with superimposed p values for a t test (thresholded at p < 0.01; T = 2.62) representing an interconnected cluster of voxels with decreases of BP in the PR group. The color scale on the left represents the range of t values from 0 to 4.8. RT, Right.

