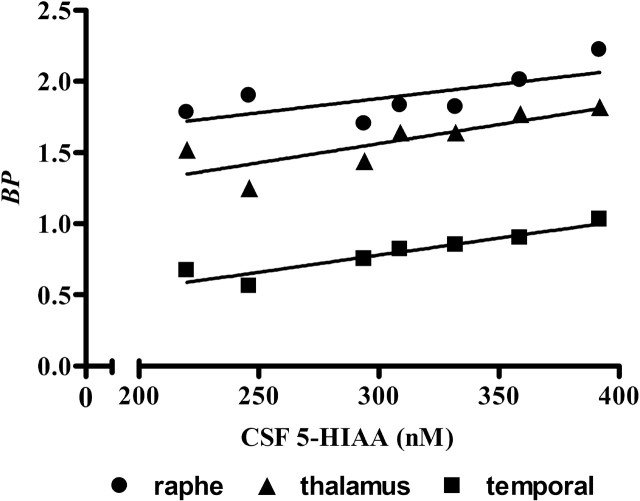
Figure 3.
Correlation between CSF 5-HIAA concentrations and SERT BP. For the PR monkey group, there was a positive linear correlation between CSF 5-HIAA concentrations and SERT BP in the raphe (r2 = 0.49; p = 0.08), thalamus (r2 = 0.68; p = 0.02), and temporal region (r2 = 0.88; p = 0.002). Oblique straight lines indicate linear regression lines.

