
Figure 7.
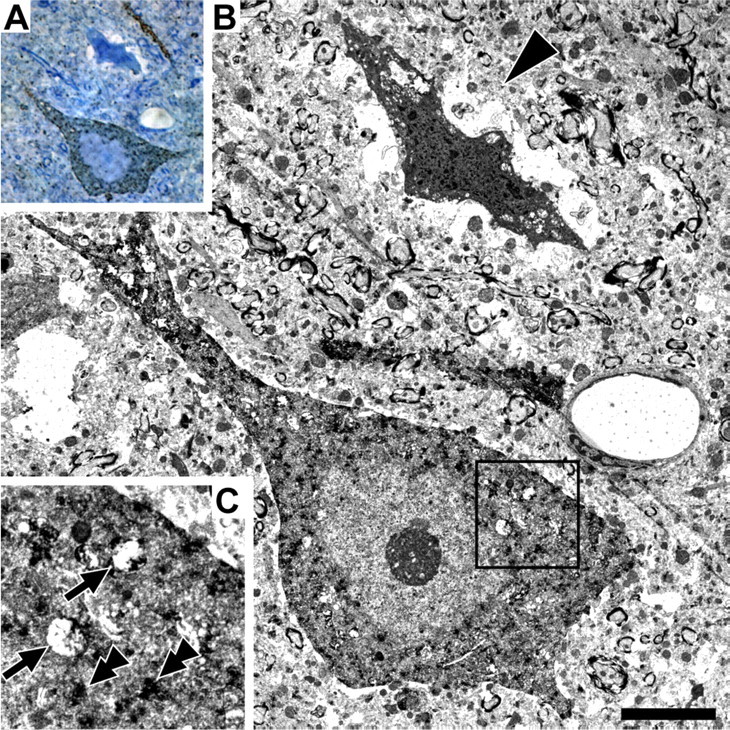
A–C, A toluidine blue-stained 1-μm-thick section reacted for the visualization of CMSP is shown in A, whereas B and C reveal an EM of the same neurons. Note that in B, one CMSP-immunopositive neuron demonstrates moderate subcellular damage. Note that C, taken from that area blocked off in B, reveals the CMSP reaction product around swollen mitochondria (arrows) and dispersed throughout the cytoplasm (double arrowheads). A neuron demonstrating overt necrosis with no evidence of CMSP is also shown (arrowhead). Scale bar, 5 μm.