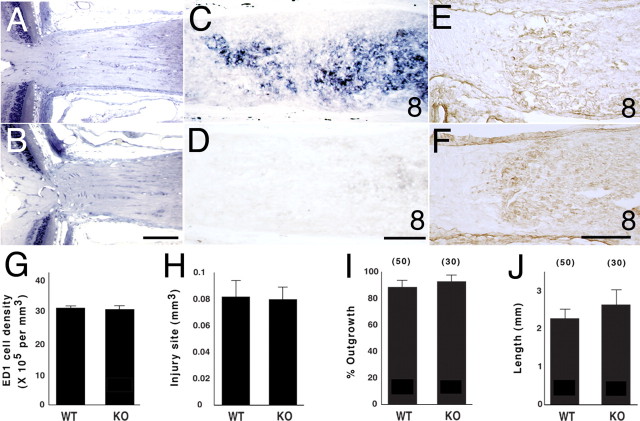
Figure 8.
Analysis of the optic nerve, macrophage accumulation, and in vitro retinal axon growth in EphB3 mutant animals. A, Plastic embedded section through a portion of the retina and the optic nerve of a wild-type adult mouse of the mixed EphB3/Thy1-YFP background. B, Plastic embedded section through a portion of the retina and the optic nerve of a homozygous EphB3 null adult mouse from the same litter as in A. C, EphB3 mRNA expression in the optic nerve of a wild-type animal of the mixed EphB3/Thy1-YFP background 8 d after injury. D, No EphB3 mRNA expression in the optic nerve of an EphB3 homozygous null littermate 8 d after injury. E, ED1+ macrophages in the optic nerve of a wild-type animal of the mixed EphB3/Thy1-YFP background 8 d after injury. F, ED1+ macrophages in the optic nerve of an EphB3 homozygous null littermate 8 d after injury. G, Graph showing the average number of macrophages per unit volume in an optic nerve lesion site. The results from three nerves in each group are shown. H, Graph showing the average total volume of the optic nerve lesion site. The results from four nerves in each group are shown. I, Graph showing the percentage of retinal explants from EphB3 null and wild-type littermate animals with axon outgrowth on a laminin substratum. The numbers in parentheses represent the number of explants in each group. No statistically significant difference was found between the genotypes (Student’s t test; p = 0.53). Data pooled from three independent experiments are shown. J, Graph showing the mean axon length per retinal explant from EphB3 null or wild-type littermate animals on a laminin substratum. No statistically significant difference was observed between the comparison groups (Student’s t test; p = 0.4). Data from three independent experiments are shown. Error bars indicate SEM. Scale bars: A, B, 100 μm; C–F, 50 μm. WT, Wild type; KO, EphB3 null.

