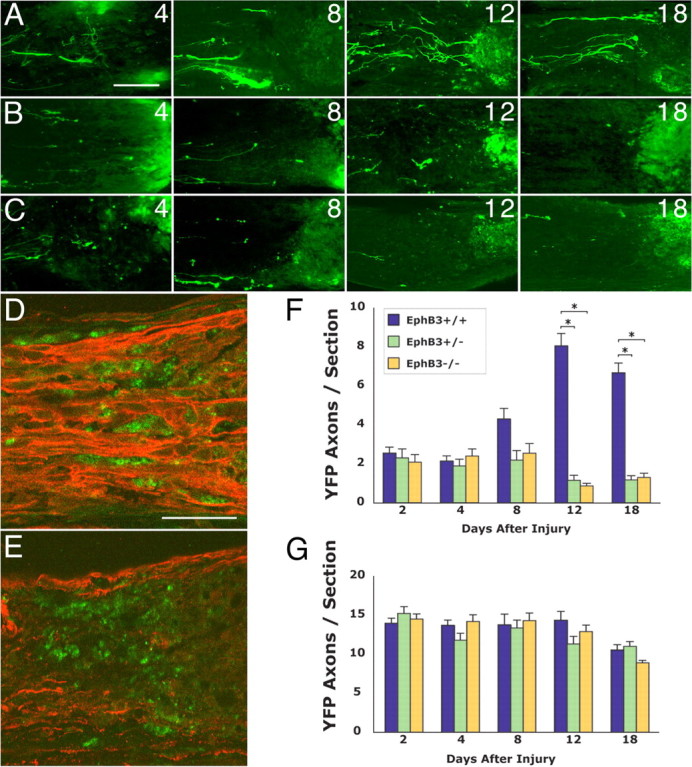
Figure 9.

Effects of reduced EphB3 function on RGC axon plasticity and remodeling in vivo. A, YFP RGC axons in the optic nerve of wild-type littermates showing RGC regrowth at 4–18 d after injury. B, YFP RGC axons in the optic nerve of adult EphB3 heterozygous littermates at 4–18 d after injury. C, YFP RGC axons in the optic nerve of adult EphB3 homozygous null littermates at 4–18 d after injury. D, The spatial relationship between regrowing retinal axons (red, anti-βIII tubulin staining) and macrophages (green, ED1 staining) 8 d after optic nerve injury in an EphB3 wild-type animal. Retinal axons course between and maintain a close spatial relationship with individual macrophages. E, The spatial relationship between retinal axons (red, anti-βIII tubulin staining) and macrophages (green, ED1 staining) 8 d after optic nerve injury in an EphB3 homozygous null animal. F, Graph showing RGC axon regrowth (quantified as axons per section) within the margin zone adjacent to the optic nerve injury site between 2 and 18 d after injury in wild-type, heterozygous, and homozygous littermates. The data from wild-type, EphB3 heterozygote, and EphB3 homozygous null mice showed a statistical difference at days 12 and 18 by the Kruskal–Wallis test (p = 0.0001). The results from EphB3 heterozygous and homozygous null animals (asterisks) were each statistically different from those from wild-type animals at 12 and 18 d as determined by pairwise comparisons using the Tukey test (differences of the mean, 5.4–7.2; 95% confidence intervals, 4.3–8.3). G, Graph showing the number of RGC axons in the ONH region between 2 and 18 d after injury in wild-type, heterozygous, and homozygous littermates. No statistically significant difference was found in the data from wild-type, heterozygous, and homozygous groups at all time points by the Kruskal–Wallis test (p = 0.12 to p = 0.96). Error bars indicate SEM. Scale bars: A–C, 50 μm; D, E, 50 μm.
