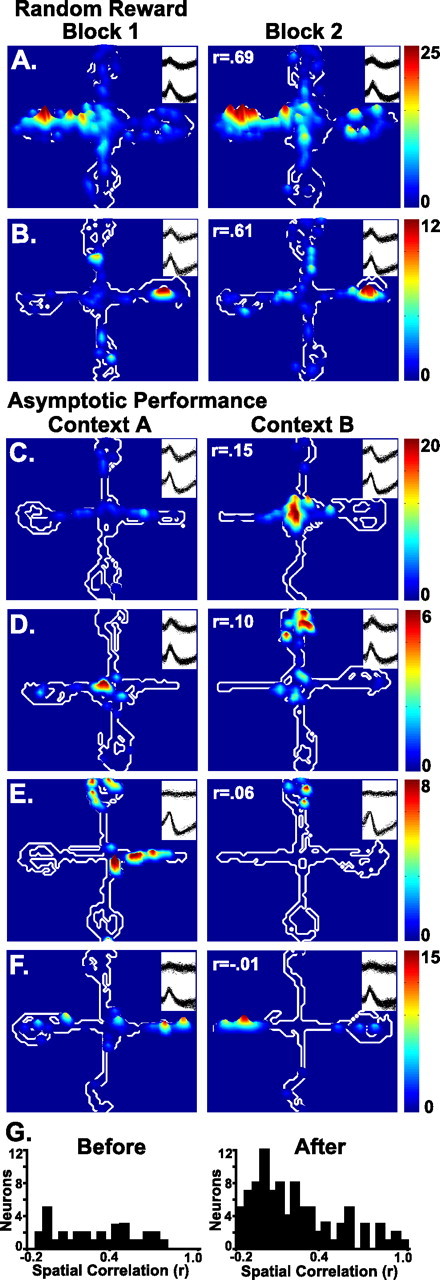
Figure 1.

Contour plots illustrating the spatial firing patterns during the random reward and asymptotic performance sessions. The regions of the maze visited by the rat are outlined in white. The firing rates are illustrated by the height and color of the contour peaks, with the scale indicated for each neuron. A and B illustrate the firing patterns of two neurons recorded during the first and second halves of the random reward session (Block 1 and Block 2). For each trial, rewards were placed at the end of randomly designated arms, and the rat started at one of the three nonrewarded arms. C–F illustrate the context-specific firing patterns of neurons recorded during asymptotic performance. Each pair of plots illustrates neuronal firing during the first half of the session (Context A), when the reward was always placed on the east arm, and during the second half (Context B), when the reward was always placed on the west arm. The firing patterns were similar across the two blocks of trials of the random reward session (A, B), but they were markedly different in the two blocks of trials (contexts) during asymptotic performance (C–F). Spike waveform overlays showing both wires of the stereotrodes recorded during each half session, and pixel by pixel spatial correlation coefficients (r) are given for each pair of plots. G illustrates the distribution of spatial correlation scores for all of the neurons that exhibited place fields before and after learning.
