
Figure 2.
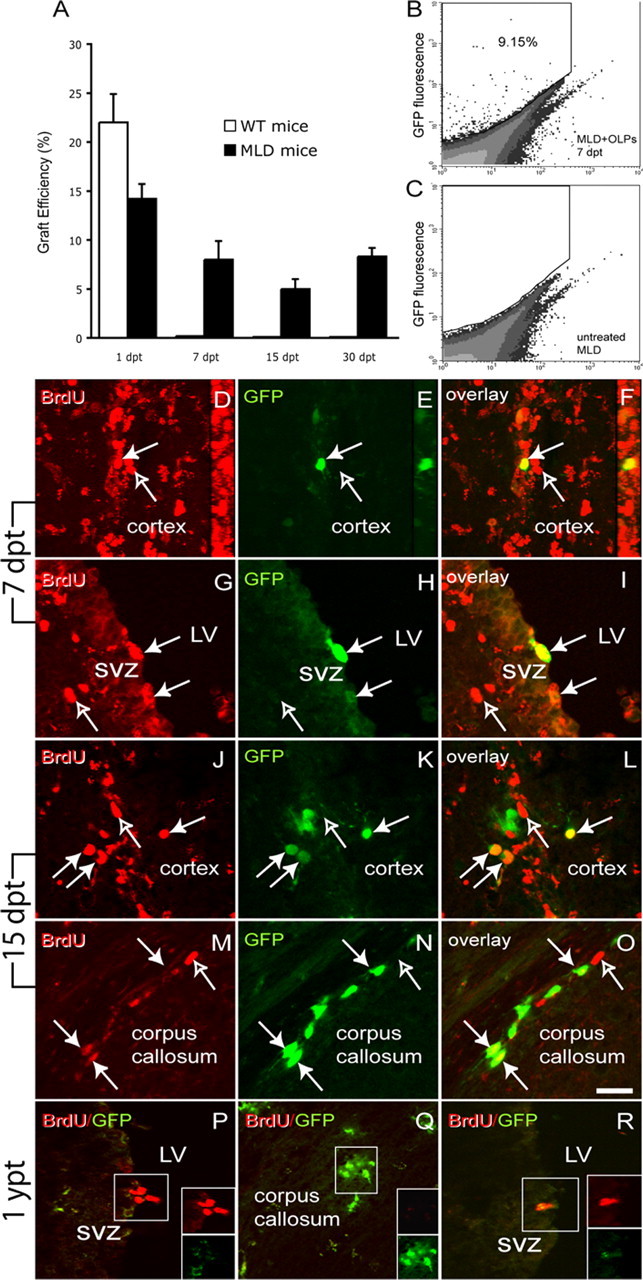
MLD brain promoted long-term survival and proliferation of OLPs. A, To estimate the efficiency of the engraftment, β-galactosidase activity was measured in total brain homogenates from transplanted MLD and healthy mice and correlated to the total enzyme activity of the input of cells at the moment of the graft. The plot shows that after an initial phase of cell death, cells transplanted in MLD pups survived better than in healthy mice, and ∼9% of the original amount of enzyme activity remained 1 month after surgery. B, C, We validated our findings on LacZ enzyme activity by FACS analysis of surviving GFP-positive cells in mice that received GFP+ OLPs. B, An example of the cytometric analysis for the presence of GFP+ cells from 7 d postinjection transplanted MLD mice, whereas C shows the FACS analysis of an untreated control. A total of 106 cells from total brain cell suspensions were acquired. To evaluate whether grafted OLPs continued to divide once transplanted in the neonate brain, we performed pulses of BrdU to detect DNA synthesis. D–R, Coronal sections of transplanted mice displaying GFP+ OLPs, counterstained with anti-BrdU antibodies (in red) and analyzed by confocal microscopy. Seven days after transplantation (D–I), GFP+ OLPs transplanted in the MLD brain were detected dividing within the cortex (D–F and the 90o rotation confocal reconstructions) and the SVZ (G–I). Fifteen days after the graft (J–O), most of the double BrdU/GFP-positive cells (filled arrows) were primarily detected in the cortex (J–L) and the corpus callosum (M–O). One year after the grafts (P–Q), BrdU+ cells were in the SVZ (P) and the hippocampal granule layer (data not shown). Transplanted GFP+ cells were found in white matter areas such as the corpus callosum (Q) but did not immunolabel with anti-BrdU, indicating their withdrawal from the cell cycle (Q). R, BrdU+ cells in the SVZ of an untreated 1-year-old MLD mouse. Scale bar: (in O) 25 μm. n = 3 mice per group per time point. dpt, Days post-transplantation; ypt, year post-transplantation; LV, lateral ventricle. Results are expressed as mean value ± SEM.