Figure 2.
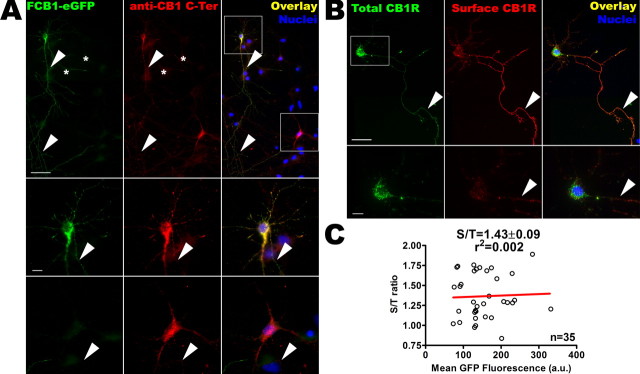
FCB1-eGFP is properly expressed and targeted to the axonal surface and somatodendritic endosomes. A, Comparison of the distribution of endogenous CB1R and transfected FCB1-eGFP by detection of eGFP fluorescence (in green) and labeling with the anti-CB1R C-Ter antibody (labeling both endogenous and transfected CB1Rs, red). The top shows soma, dendrites, and axonal arborization of an FCB1-eGFP transfected neuron (top left box) together with a neuron expressing endogenous CB1R (bottom right box). Positive neurons are surrounded by CB1-negative neurons (asterisks, nuclear staining in blue). CB1R as well as FCB1-eGFP show vesicular staining in the somatodendritic compartment (boxed) and homogenous staining on the axon (arrowheads). Notably, the comparable intensity of C-Ter antibody labeling (red) shows that transfection of FCB1-eGFP leads to expression levels similar to those of endogenous CB1Rs. Bottom panels show details of neurons boxed at the top. Vesicular staining can clearly be seen in the soma and in dendrites, together with emergence of the labeled axon (arrowheads). Scale bars: top, 50 μm; bottom panels, 10 μm. B, Presence of the FLAG epitope allows highly sensitive labeling of surface receptors (in red) by rapid live incubation of transfected neurons with M1 anti-FLAG antibody. Intracellular eGFP labeling (in green) is brighter than surface eGFP labeling, because of the concentration of receptors in endosomes. Because of the high sensitivity of the red FLAG epitope surface labeling, surface CB1Rs are far more visible in the red channel than in the green channel (see in axons where surface receptors are more visible in the red channel than in the green channel; arrowheads). Surface CB1Rs are hardly detectable on the somatodendritic plasma membrane [see red channel in boxed region, detailed in bottom image], whereas they are concentrated in the axon (arrowheads). Scale bars: top, 50 μm, bottom, 10 μm. C, FCB1-eGFP construct allows to measure the CB1R S/T ratio on the somatodendritic compartment of individual neurons using the ratio between green (eGFP total receptor fluorescence) and red (surface labeling with M1 antibody) channels. This ratio does not depend on the FCB1-eGFP level of expression in each particular neuron; there is no correlation between the value of mean eGFP fluorescence and the value of the S/T ratio for 35 individual somas of FCB1-eGFP expressing neurons in the control condition, as plotted here (r2<0.02, as assessed by Pearson’s test). This implies that surface expression of CB1R does not depend on transfection potency or variation in expression levels between individual neurons or between experimental conditions. The data points shown come from three independent experiments.

