Figure 7.
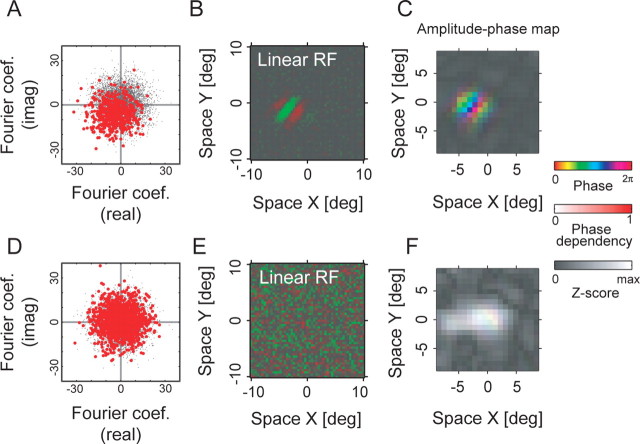
Spatial phase sensitivities are calculated for a simple cell (A–C) and a complex cell (D–F). A, Fourier coefficients for the maximally effective spatial frequency component in stimuli that led to spikes are shown (red dots) for the optimal correlation delay of 45 ms. The centroid of red dots is offset from the origin indicating selectivity for a given phase. For estimating the distribution for the noise stimuli themselves, Fourier coefficients for the same frequency component are also shown for all frames of the subfield of noise sequence (gray dots). Only the coefficients for one frequency component for the maximally responsive subfield are used. B, Spatial receptive field map obtained by a standard reverse correlation procedure. C, Spatial structure of the phase dependency. The optimal spatial phase, PSI (see Results), and signal amplitude of the LSRC analysis are represented as hue, saturation, and brightness, respectively. D–F, The same as A–C, but for a complex cell. The two cells are the same as those shown in Figure 4. For C and F, the maximum values for the Z-scores were 34.1 and 17.5, respectively. coef., Coefficient; imag, imaginary; deg, degree; RF, receptive field; max, maximum.

