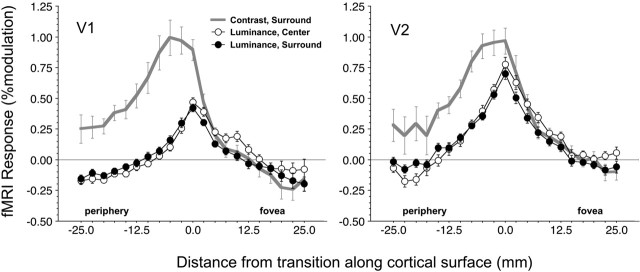
Figure 3.
Mean responses in V1 and V2 of five subjects (10 hemispheres) during central disk (open circles) and surround (filled circles) modulation as a function of cortical distance from the representation of the transition between center and surround (at distance 0) are shown. Negative distances are in the direction of the periphery of the visual field, and positive distances are in the direction of the fovea. Also plotted is response to a surround contrast (checkerboard) stimulus (gray curve). Results are averaged over hemisphere and contrast (in the case of the 2 brightness-inducing stimuli). Bars show SEM over hemispheres.

