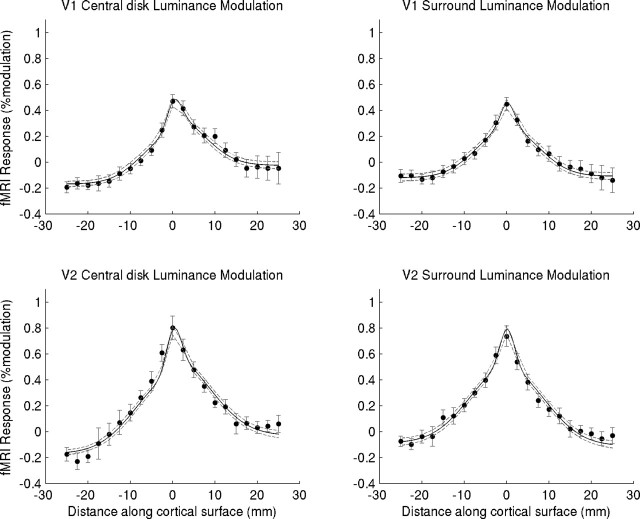
Figure 6.
Modeling fMRI responses in V1 and V2 during central disk and surround luminance modulation. Results are shown as a function of cortical distance from the transition between center and surround (at distance 0). Negative distances are in the direction of the periphery of the visual field, and positive distances are in the direction of the fovea. Filled symbols are data points (averages of 6 subjects, 2 hemispheres each) with 95% confidence intervals, indicated by gray error bars (data averaged over contrast, subject, and hemisphere). The black line is model fit with 95% confidence intervals indicated by dashed gray lines. Model components are described in Figure 5. See supplemental material (available at www.jneurosci.org) for detailed model description, fitting procedure, and model selection.

