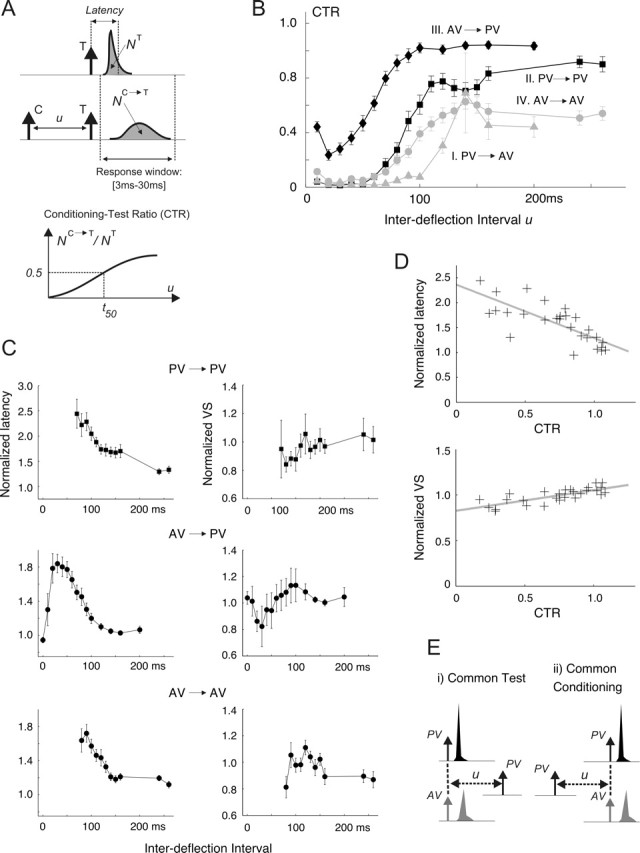
Figure 2.

The effects of pairwise interactions on the deflection response. A, The CTR was computed for a range of IDIs by (1) computing the spike-count response to the test (T) stimulus (NC→T) in presence of a preceding conditioning (C) deflection and (2) normalizing this quantity by the response measured when T is presented in isolation (NT). Spike count is computed as the area under the measured PSTHs over the 3–30 ms poststimulus time window. Latency represents the center of mass of the PSTH. VS quantifies the precision of the PSTH response and is defined in Materials and Methods (see Response measures). B, Average CTR measurements for pulse stimuli: I, PV→AV (gray triangles); II, PV→PV (black squares); III, AV→PV (black diamonds); IV, AV→AV (gray circles). Error bars represent 1 SEM, computed with n = 18. Qualitatively similar results were obtained using square-wave stimuli (n = 12). C, Both the latency and the VS of test responses in the presence of the conditioning stimulus are normalized to the values measured for the test presented in isolation. The resulting normalized latency (left column) and VS (right column) curves are shown for the PV→PV, AV→PV, and AV→AV interactions. The corresponding results for PV→AV are not shown because the majority of the estimates were unreliable as a result of the typically small AV responses (see text). D, The top scatter plot shows the relationship between the CTR value and the normalized latency of the PV response; PV→PV and AV→PV data are combined, so that each point on this plot corresponds to an average measurement at a given IDI. The x-coordinate of the point is the population-averaged (n = 18) CTR value at that IDI; its y-coordinate represents the corresponding population-averaged normalized latency. The gray line shows the linear regression of the latency ratio onto the CTR value (r = −0.76; p < 1e-4; y = −1.08x + 2.36). The bottom scatter plot illustrates an analogous relationship between the CTR value and the normalized test VS (r = 0.77; p < 1e-4; y = 0.23x + 0.83). E, Conditioning→test sequences are divided into two groups. i, Common test stimulus (left). For pulse stimuli, these consist of PV→PV and AV→PV. ii, Common conditioning stimulus (right), which for pulse stimuli considered here consist of PV→PV and PV→AV. A similar grouping can also be made using the AV→AV as the basis for comparison (in place of PV→PV).
