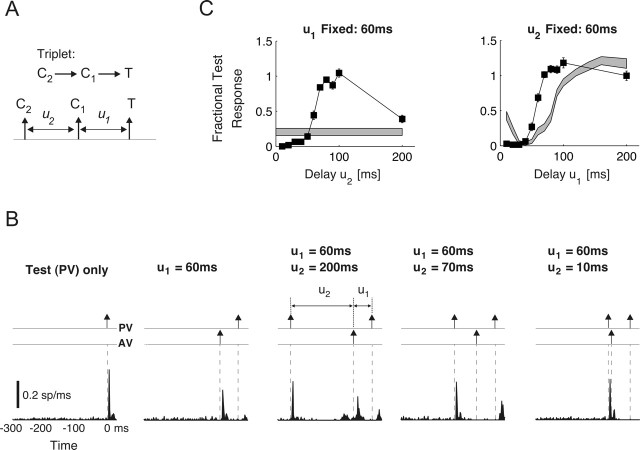
Figure 3.
Nonlinear response interactions. A, Schematic of stimulus triplet. For the sequence C2→C1→T, the test response is measured under two scenarios. First, delay u1 was fixed at 60 ms, and u2 varied over the range 0–200 ms in 10 ms increments. Next, u2 was fixed at 60 ms as u1 varied over the same range. B, PSTH responses for the sequence C2→C1→T (specifically, PV→AV→PV) for different values of delay u2. The leftmost plot shows the first-order test (PV) response. To its right, the response to the pairwise sequence AV→PV is shown (u1 = 60 ms). The next three plots show the response to the third-order sequence PV→AV→PV as the delay u1 was fixed at 60 ms, whereas u2 equaled 200, 70, and 10 ms, respectively. C, The third-order normalized spike counts (fractional test response curves) for the cell shown in B are shown as functions of u2 (left, ▪; u1 = 60 ms) and of u1 (right, ▪; u2 = 60 ms). Error bars show ±1 SEM. The gray bands represent the corresponding measurements (and their associated uncertainties) for the second-order sequence C1→T over the same delay range u1 and u2 (mean ± 1 SEM).

