
Figure 5.
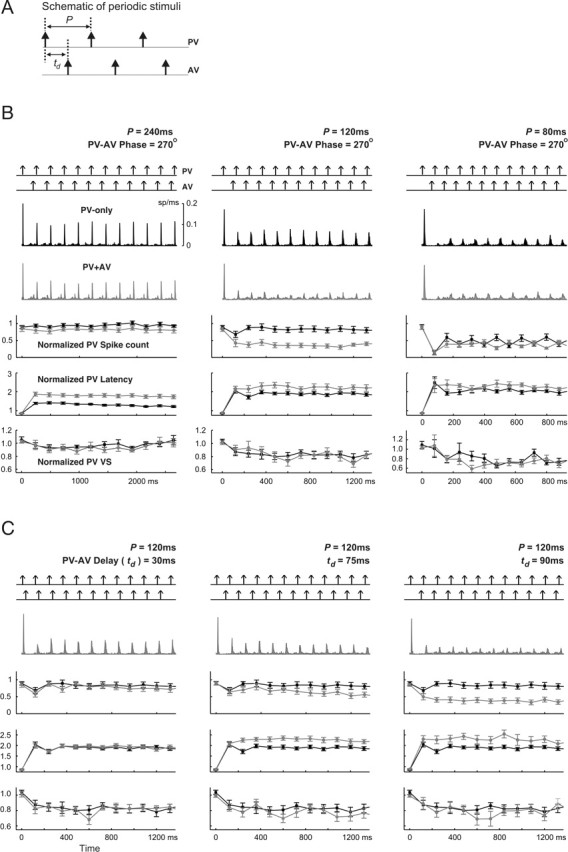
Frequency and phase dependence of transient responses to periodic stimuli. A, Schematic of periodic stimuli. For PV-only cases, stimulation period P took five values: 240, 120, 80, 60, and 30 ms. For the two-vibrissa case, first the PV–AV phase delay was fixed at 270°, whereas the period ranged over the same values as above. Next, the stimulation period was fixed at 120 ms, whereas the PV–AV time delay td varied over the range 30–90 ms in 15 ms increments. B, Each column represents results from a distinct stimulation pattern (from left to right: 240, 120, and 80 ms). For each column, the top panel in each plot represents the periodic pulse deflections and the middle two panels show the average firing rate for all cells (n = 18) in response to PV-only and two-vibrissa (PV and AV) stimuli (top plot, PV-only response, black; bottom plot: response to PV and AV, gray). The next three panels show, respectively, the normalized spike counts, latencies, and VSs of PV responses evoked by single (black) and combined (gray) PV–AV deflections. Error bars represent ±1 SEM. C, Dependence of transient responses on the PV–AV time delay for a stimulation period of 120 ms. Results for td = 30, 75, and 90 ms are shown in the left, middle, and right columns, respectively. For each column, the order of the panels is the same as that described in B.