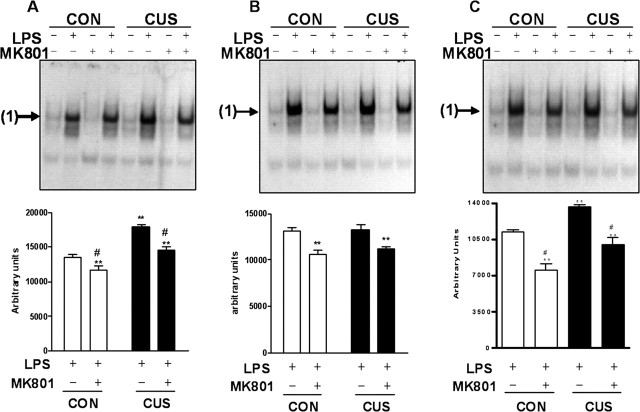
Figure 5.
Influence of MK-801 on NF-κB activation induced by LPS in the frontal cortex (A), hypothalamus (B), or hippocampus (C) of unstressed (CON) or stressed (CUS) rats. Top, Representative EMSA autoradiography. The position of specific NF-κB/DNA binding complex p65/p50 (band 1) is indicated. Bottom, Densitometric analysis of the band 1 (representing p65/p50 heterodimers) of LPS-treated groups presented in the top panel (mean ± SEM; n = 6 animals per group). Bonferroni’s test: **p < 0.05 versus CON plus LPS; #p < 0.05 versus CUS plus LPS.

