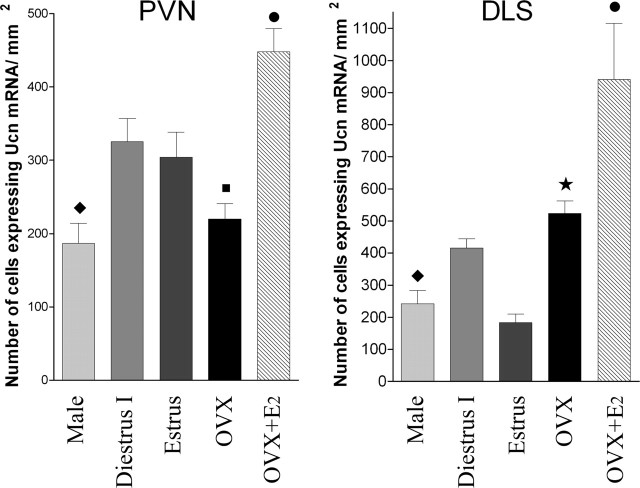
Figure 7.
In situ expression of Ucn mRNA in different endocrine status in the PVN and DLS of the rat brain. Coronal tissue sections were processed for ISH using the U1 DIG-labeled probe. Values correspond to the mean ± SEM of three to seven independent experiments. Analysis by one-way ANOVA showed a significant difference between experimental conditions in both areas studied (PVN: F = 14.17, R2 = 0.76, p < 0.0001; DLS: F = 8.65, R2 = 0.60, p < 0.0002). Newman–Keuls multiple comparison post hoc test gave the following significances: PVN, •, p < 0.05 compared with estrus, p < 0.01 compared with diestrus I, and p < 0.001 compared with male and OVX, ♦, p < 0.05 compared with diestrus I and estrus, ▪, p < 0.05 compared with diestrus I and estrus; DLS, ♦, p < 0.001 compared with diestrus I, and OVX, •, p < 0.01 compared with diestrus I, estrus, and OVX, and p < 0.001 compared with male, ★, p < 0.05 compared with diestrus I and p < 0.01 compared with OVX.

