
Figure 2.
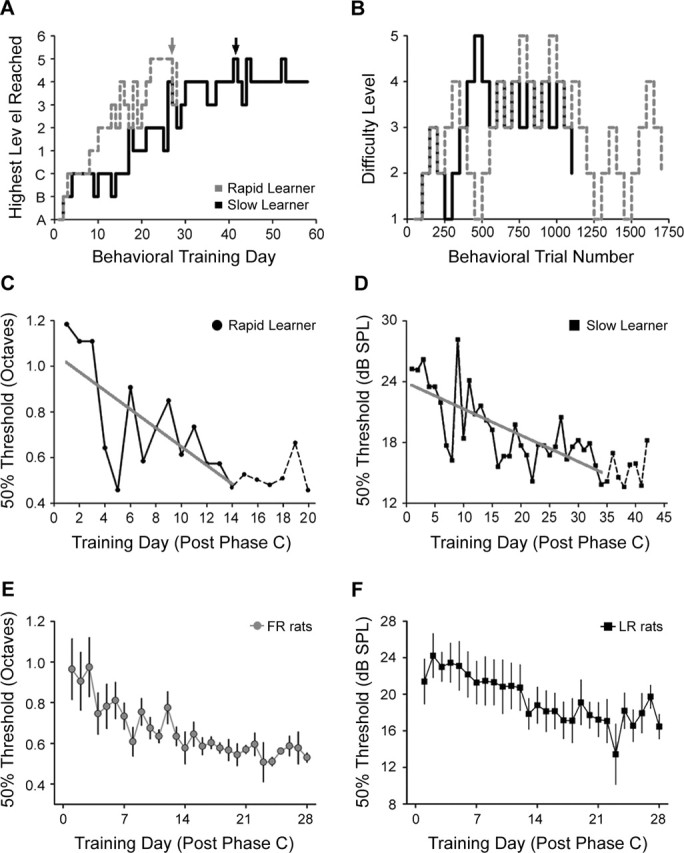
Documentation of perceptual learning in the auditory recognition task. A, The highest training phase reached on an individual day of training is shown across the entire training period for one rat in the FR task categorized as a rapid learner (dashed gray line) and one rat in the LR task classified as a slow learner (solid black line). The description of auditory stimuli used in each phase is provided in Table 1. B, Task performance for the same rats shown in A obtained from a single day of training (indicated by black and gray arrows in A) is shown to illustrate the adaptive tracking protocol. C, D, Fifty percent recognition thresholds plotted across each training day for the same rapid learning rat (C) and slow learning rat (D). Changes in the recognition threshold between the first day of training until performance reached an asymptotic level were fit with a linear regression (thick gray line), and the slope of the regression line was defined as the slope of the learning curve. Dashed lines indicate post-asymptotic training days that were not included in the slope calculation. E, F, Target recognition threshold values (mean ± SE) across the first 28 d of training for all rats in the FR (E) and LR (F) tasks.