
Figure 2.
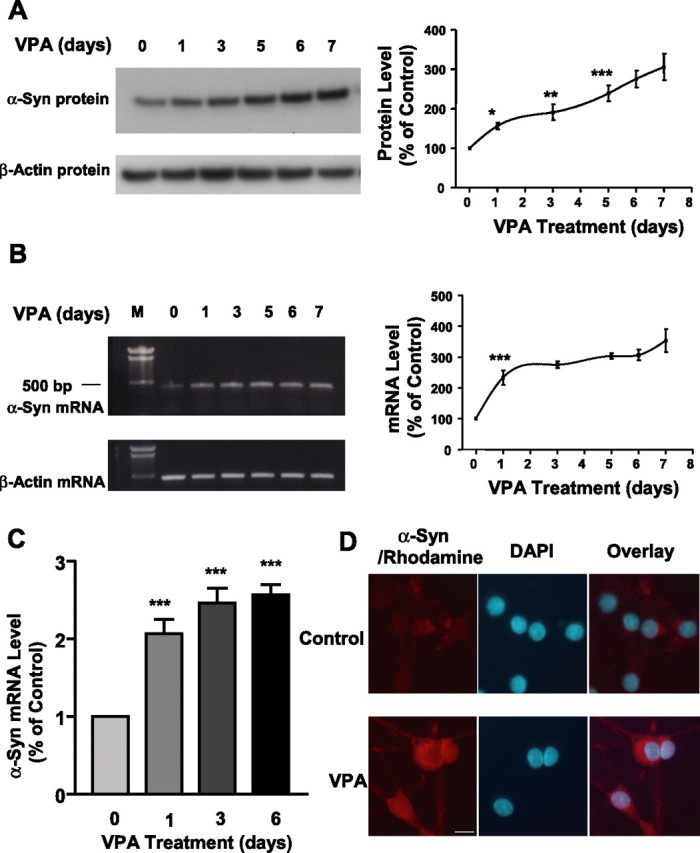
VPA-induced increase in the levels of α-syn protein and mRNA is duration dependent. CGCs were treated with 0.4 mm VPA for 1–6 d, and all cultures were harvested on DIV 7 for Western blotting of α-syn protein levels (A) and RT-PCR of α-syn mRNA levels (B). The left lane in B is the DNA marker (M). Levels of β-actin protein and mRNA were used as the control in A and B, respectively. Quantified results are shown in the respective right panels in A and B and are expressed as means ± SEM of four independent experiments. ∗p < 0.05; ∗∗p < 0.01; ∗∗∗p < 0.001 compared with the 0 time control. α-Syn mRNA levels were also quantified by real-time PCR in CGCs treated with 0.4 mm VPA for 1, 3, and 6 d (C). Data are means ± SEM of three independent experiments. ∗∗∗p < 0.001 compared with 0 time control. VPA-treated and untreated CGC cultures were also examined for α-syn immunofluorescence as described in Materials and Methods (D). α-Syn immunostaining was identified by incubation with goat anti-mouse Rhodamine Red-X-AffiniPure-conjugated secondary antibody and is shown in red, and the nuclear staining by DAPI is shown in blue. The overlay images are also shown. Scale bar, 10 μm.