
Figure 6.
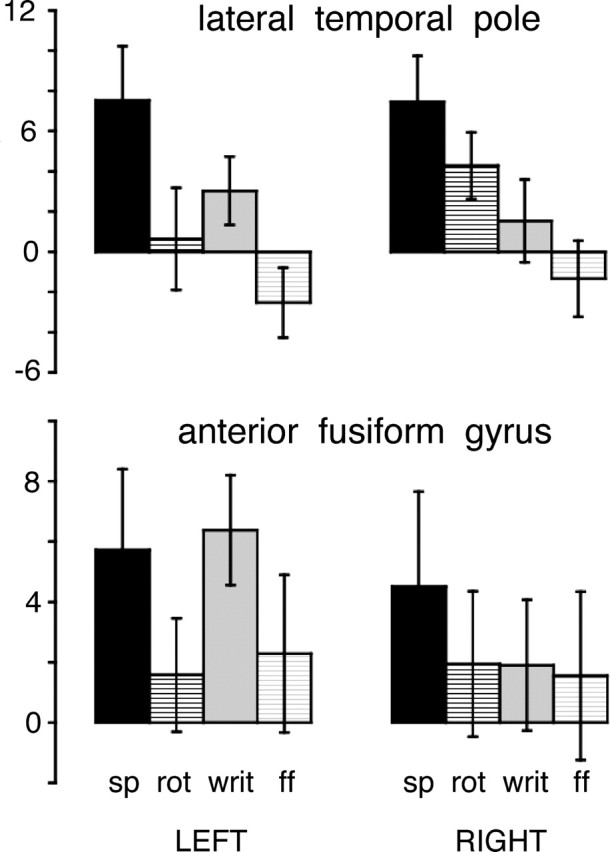
Histograms of mean estimated effect sizes (in arbitrary units), with 95% confidence intervals, in two anterior temporal ROIs in each hemisphere: the lateral TP and the anterior FG. The language conditions are shown as columns for speech (sp) and written text (writ). The unintelligible baseline conditions are shown as columns for rotated speech (rot) and false font (ff). The mean effect sizes for all four conditions are relative to the common baseline condition of the number task.