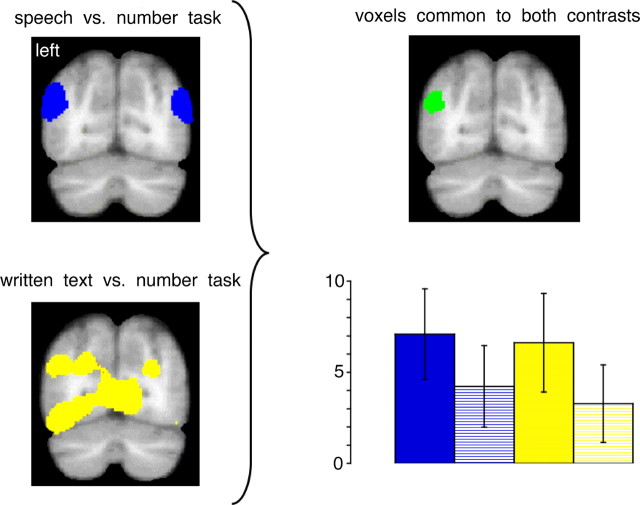
Figure 7.
Activity at the TOP junction associated with speech (top left, in blue) and written text (bottom left, in yellow), each contrasted with the number task, coregistered onto a mean anatomical coronal magnetic resonance image, 72 mm posterior to the anterior commissure. There were voxels common to these two contrasts at the left TOP junction (top right, in green). Histograms of mean estimated effect sizes (expressed in arbitrary units), with 95% confidence intervals, in this region are shown (bottom right). The language conditions are shown as a blue column for speech and a yellow column for written text. Their unintelligible baseline conditions are shown as a blue-hatched column for rotated speech and a yellow-hatched column for false font. The mean effect sizes for all four conditions are relative to the common baseline condition of the number task.

