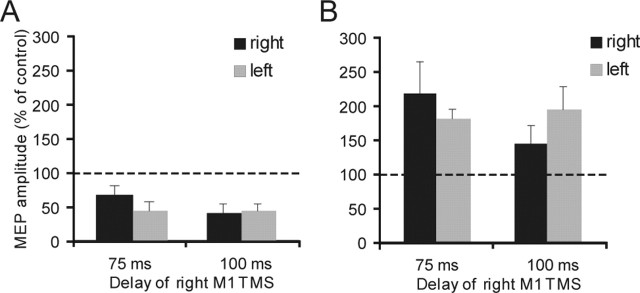
Figure 6.
Mean percentage values of the change on MEP amplitudes for SICI at 3 ms ISI (A) and ICF at 10 ms ISI (B) obtained in experiment 2 with ppTMS of the right M1. Strong inhibition and facilitation were found, although no difference across time and sides emerged. Black bars indicate an instruction to move right; gray bars indicate an instruction to move left. Error bars indicate SEM.

