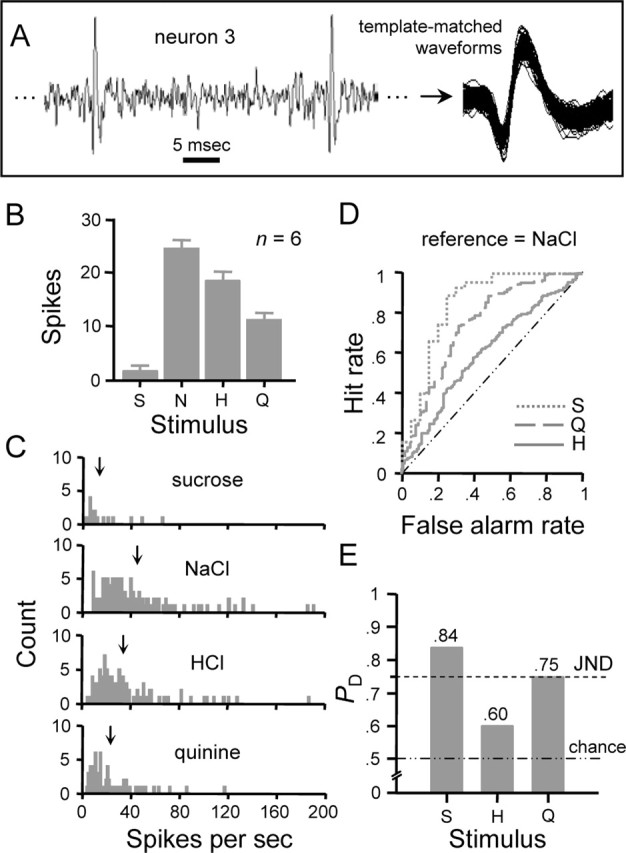
Figure 7.

Rate coding performance of an individual NST gustatory neuron. A, Spiking activity sampled from neuron 3 (Table 1) when under taste drive. Template-matched spikes are also shown. B, Response profile showing the average ± SE number of spikes produced by each stimulus in 1 s over six trials. C, Frequency distributions of instantaneous firing rates to the four stimuli built over six presentations of each stimulus. ↓, Mean spike rate. D, Family of curves describing the outcome of ROC analysis applied to pairs of distributions in C. For this neuron, the distribution produced by NaCl was compared with that for each secondary stimulus. Resulting ROC curves are indicated by the legend according to the secondary stimulus. Each curve describes the relationship between the hit rate (ordinate) and false alarm rate (abscissa) observed at each response criterion level. E, Neurometric profile showing probabilities (ordinate) that an observer of the instantaneous firing rate in this neuron could use knowledge of the means of the distributions in C to correctly discriminate between responses to NaCl and each secondary stimulus, which are listed along the abscissa. Each probability, PD, is given by the area under the corresponding ROC curve in D. PD = 0.75, JND between responses to NaCl and a secondary stimulus (dashed line). PD = 0.50, chance discrimination performance (dotted/dashed line). S, Sucrose; H, HCl; N, NaCl; Q, quinine.
