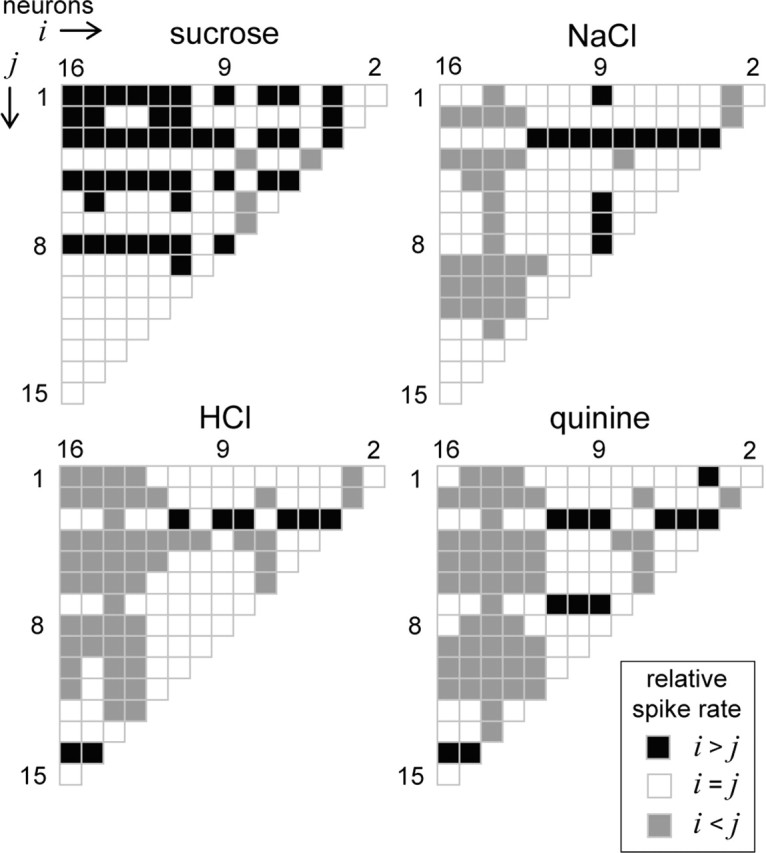
Figure 9.

Decoding stimulus input by comparing firing rates among multiple neurons considered in parallel. Each half-matrix describes for a stimulus the pattern of relative spiking relationships that emerged across all possible pairs of NST neurons in our sample of 16 (Table 1). Neurons are sequentially ordered into vectors i and j along the columns and rows, respectively, of the half-matrices. Each matrix element is color coded to reflect the relative spiking relationship (legend) observed between a particular pair of cells, as determined by ROC analysis of spike rate distributions. For this analysis, the distribution of the neuron with the higher absolute mean spike rate was used as the reference, and the resulting probability of correct discrimination, PD, was compared with a difference threshold of 0.75 to determine the direction of the relative spiking relationship. It can be seen that sucrose, NaCl, HCl, and quinine produce unique patterns of relative spiking among these cells. A priori knowledge of the pattern of relative responding associated with each stimulus could, in principle, be used to discriminate among these stimuli.
