
Figure 4.
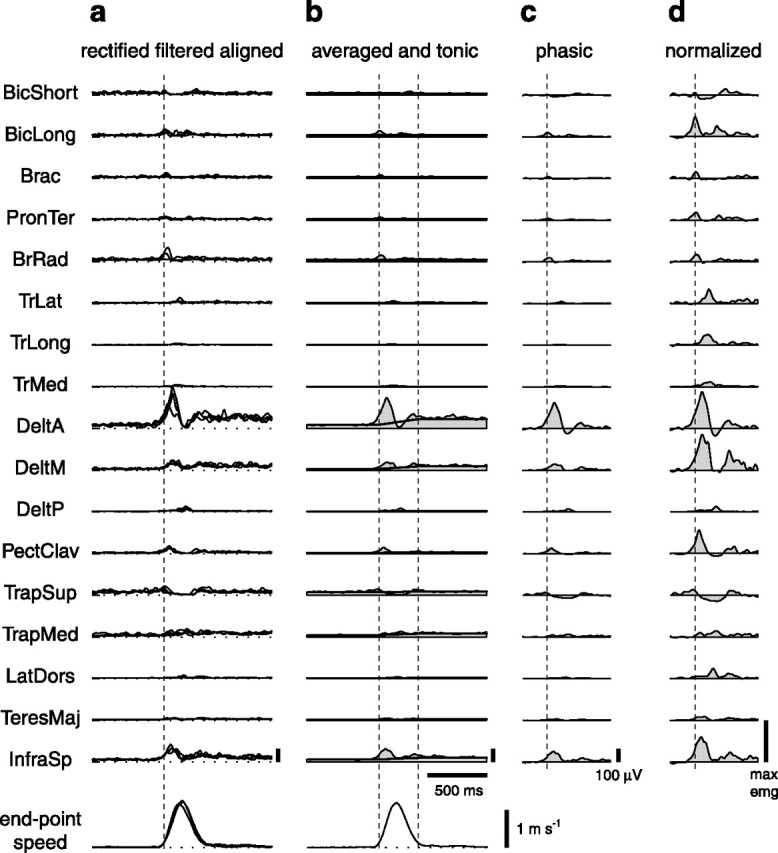
Estimation of phasic EMG patterns. The rectified and filtered EMGs for all repetitions of the same movement (a) were aligned to the time of movement onset and averaged (b, thin line and shaded area). For each muscle, the phasic EMG waveform (c) was constructed by subtracting a linear ramp from the tonic level of that muscle before movement onset to the tonic level after movement end (b, thick line) to the average EMG. Each muscle was then normalized to the maximum of that muscle over all conditions (d) (see Materials and Methods). Abbreviations for muscles are shown in Table 1.