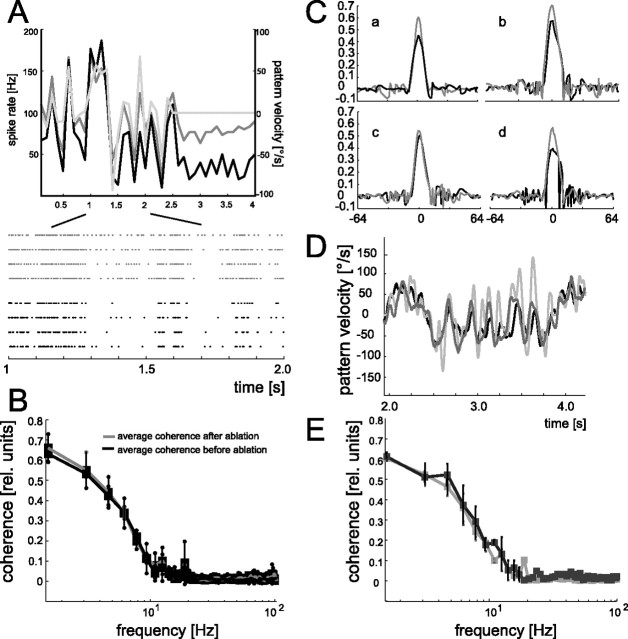
Figure 3.
A, Mean spike rate (the response trace is plotted with a temporal resolution of 10 Hz) of V1 during dynamic motion stimulation before (black line) and after (dark gray line) ablation of a VS2/3 cell (same V1 cell as in Fig. 2A). The motion-induced spike responses modulate similarly with motion velocity before and after ablation. The gray line shows the velocity profile of a section of the dynamic motion stimulus followed by a time interval, during which the pattern was stationary (same temporal resolution as the spike response traces). Positive values of motion velocity indicate preferred-direction motion, and negative values indicate motion in the null direction. To obtain the spike-frequency histogram, response traces were averaged over four stimulus repetitions. Bottom, Raster plots of the individual responses before (black) and after (gray) ablation to an excerpt of the dynamic motion trace. Each dot indicates the occurrence of a V1 spike. B, Mean coherence values averaged over the control experiments with an extended dataset (gray line; n = 10 presentations of each of the 8 dynamic motion traces; n = 5 experiments) as well as with an additional longer-lasting dynamic motion sequence (black line; n = 25 presentations of the motion trace; n = 8 experiments). C, Impulse responses of the reconstruction filters obtained for the four ablation experiments before (black lines) and after (gray lines) ablation of a VS2/3 cell (experiment shown in A is denoted by the lowercase a). D, Segment of the motion-velocity trace (gray line) and the estimated stimulus as derived from convolving the responses with the reconstruction filters before (black line) and after (dark gray line) ablation. Data are from the experiment in A and in a. E, Mean coherence values averaged over all four ablation experiments together with the corresponding SDs. The comparison between the coherence functions of the V1 cells before (solid line) and after (gray line) reflect a robust representation of motion velocity. Coherence functions were determined to quantify the relationship between the dynamic motion stimuli and corresponding V1 responses. In each experiment, data were gathered from V1 responses to eight dynamic motion traces; each motion trace was presented four times.

