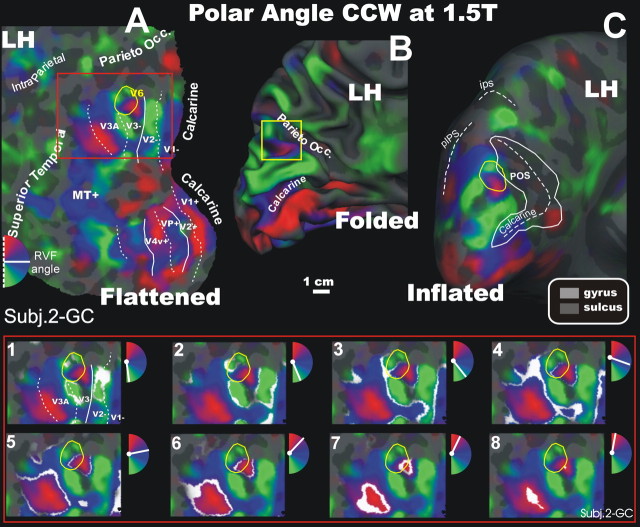
Figure 3.
Retinotopy of polar angle representation of area V6 at 1.5T (CCW stimulus). Fattened (A), folded (B, white-matter version), and inflated (C) reconstructions of the left hemisphere (LH) of another participant (Subj.2-GC) are shown. In the bottom part of the figure, a detailed organization of the polar angle representation is shown using close-up views of the flattened left hemisphere of the same subject (red box). The white areas on each panel represent the cortical regions activated by a single polar angle, indicated in white in the small hemifield icons located at the upper right of each snapshot. Other labels and logos are as in Figure 2. IPS, Intraparietal sulcus. RVF, Right visual field.

