
Figure 1.
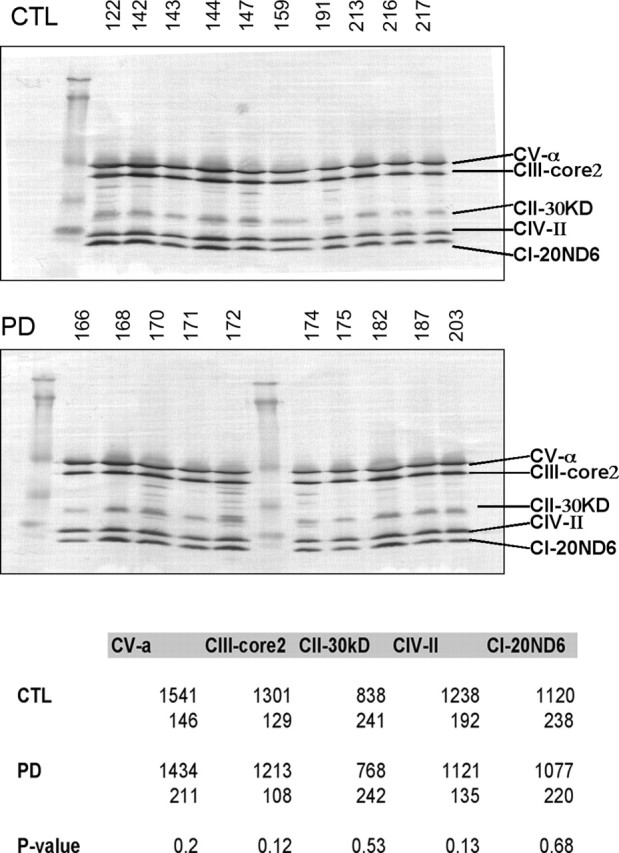
Western blot of CTL and PD brain mitochondrial ETC subunits. The same mitochondrial preparations from frontal cortex samples were used for all figures. The blot images are shown for CTL and PD mitochondrial samples. The table at the bottom gives the actual mean band densities with the SDs underneath. p values for comparing the CTL and PD groups did not demonstrate any significant differences. See Materials and Methods for details. CI–CV, Complex I–V.