
Figure 2.
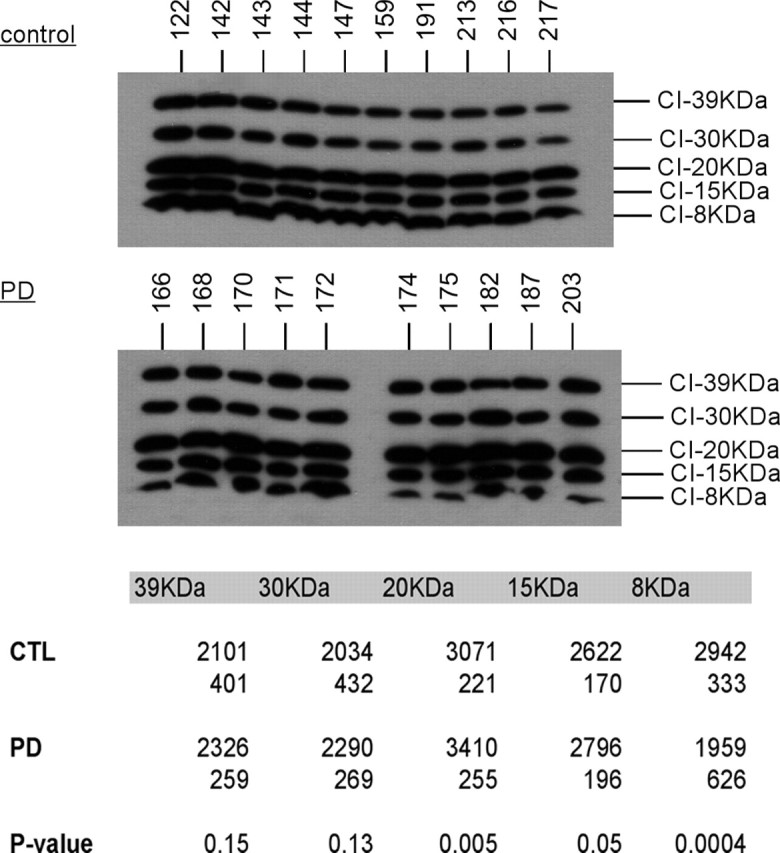
Western blot of CTL and PD mitochondria for complex I subunits. The same mitochondrial preparations from frontal cortex samples were used for all figures. The blot images are shown for CTL and PD mitochondrial samples, and localization of the complex I subunit bands was performed as described previously (Triepels et al., 2001; Murray et al., 2003). The table at the bottom gives the actual mean band densitites with the SDs underneath. p values indicated highly significant differences for the 20 and 8 kDa subunits. See Materials and Methods for details.