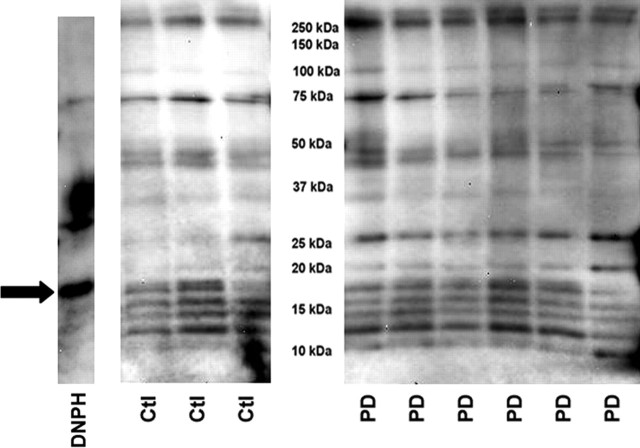
Figure 3.
Protein carbonyl levels in immunocaptured complex I samples. The same mitochondrial preparations from frontal cortex were used for all figures. Shown are immunoblots derived from 10 μg protein samples of immunocaptured complex I from three CTL (Ctl) and six PD brains after derivatization with DNPH, SDS-PAGE, transfer, and immunostaining for DNPH. The band on the far left (“DNPH”) shows the location and relative intensity of the DNPH protein standards. The arrow points to DNPH-trypsin inhibitor band, which was used as a standard to normalize all the other detected bands. MW marker bands are not shown. See Materials and Methods for details.

