
Figure 6.
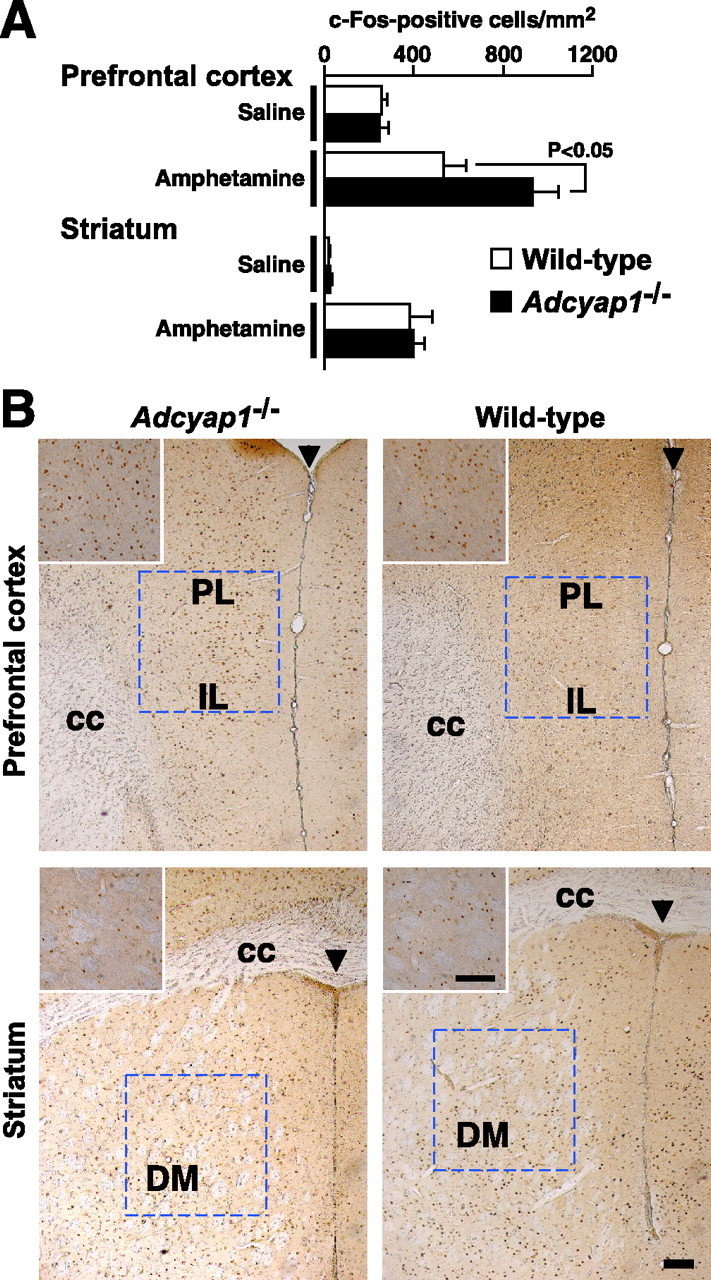
c-Fos-positive neurons in medial prefrontal cortex and dorsomedial striatum in amphetamine-treated Adcyap1−/− mice. A, Number of c-Fos-positive neurons in the outlined regions in B in wild-type (open bars) and Adcyap1−/− (closed bars) mice that received 10 mg/ml amphetamine. n = 6–7 per group. B, Photomicrographs showing representative c-Fos labeling in medial prefrontal cortex (top panels) and dorsomedial striatum (bottom panels) in amphetamine-treated Adcyap1−/− (left panels) and wild-type (right panels) mice. Insets, High magnifications of c-Fos staining. PL, Prelimbic cortex; IL, infralimbic cortex; DM, dorsomedial striatum; cc, corpus callosum; arrowheads, midline. Scale bars, 100 μm. Data are expressed as means ± SEM.