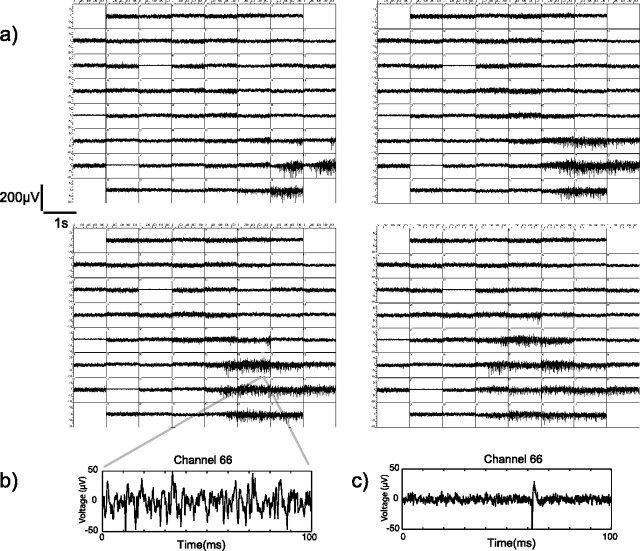
Figure 1.
Analog multielectrode array recordings during a wave of activity from developing E60 monkey retina. a, Each of the four panels consists of 61 individual electrode traces arranged on a grid that approximates the rectangular electrode array geometry. Within each panel, each electrode trace shows 1 s of data. The panels are arranged to be consecutive in time left-to-right for a total of 4 s of data displayed. The wave begins in the bottom right corner of the array and spreads up and to the left over the next 4 s. b, An example of a 100 ms section of raw analog data taken from a particular electrode during a wave. c, An example of a single unit in another 100 ms segment from this same electrode before this wave.

