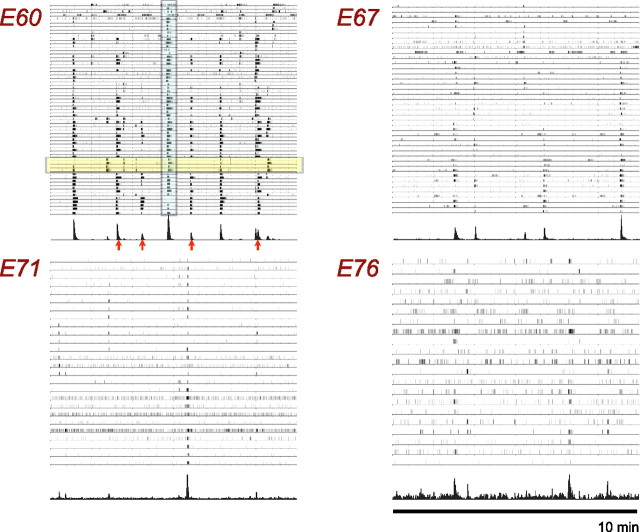
Figure 2.
Representative spike trains for 10 min of recording taken at four developmental ages E60, E67, E71, and E76. A histogram of the total activity across the entire array is also shown beneath each raster plot to assist in identifying a retinal wave. Units of histogram are cell spikes per second. Arrows and blue highlighted area indicate the times of particular wave events discussed in Results. Spike trains highlighted in yellow indicate examples of cells that do not participate in every wave event. The different number of traces in each panel reflects the different number of cells identified in each recording.

