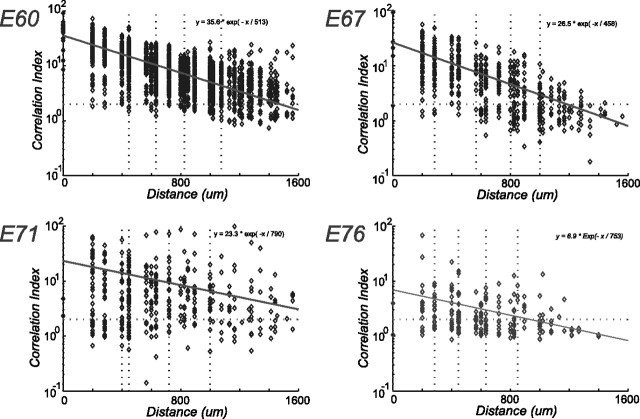
Figure 5.
Spatial dependence of the correlation index with developmental age. For each age, a scatter plot of the correlation index versus intercell distance for all cell pairs is shown together with an exponential fit of the data (trend line). The parameters of these fits are shown in the top right of each plot. The vertical dotted lines denote the quintile boundaries. Although there is a clear trend of decreasing correlation index with intercell distance, there is a wide distribution of values at any given intercell distance.

