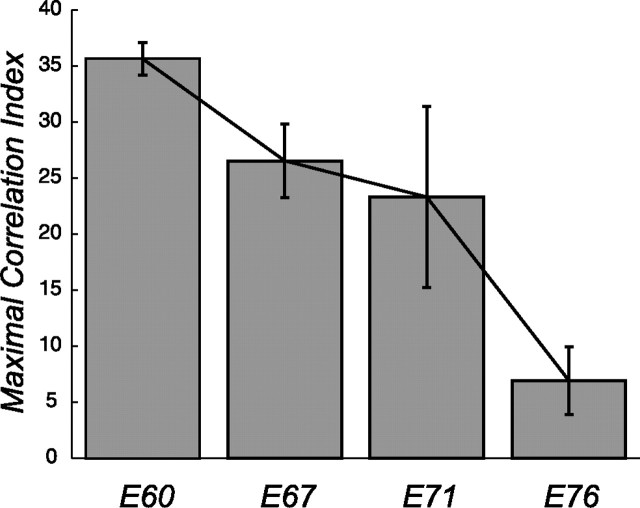
Figure 6.
Dependence of the maximal correlation index with developmental age. The y-intercepts (maximum correlation index) from the scatted plots of Figure 5 are a measure of the strength of the overall correlated firing in the recording. The maximum correlation index is plotted for each age together with the 95% confidence limits obtained from the exponential fit. The degree of correlated firing decreases steadily over the ∼2 week period from E60 to E76.

