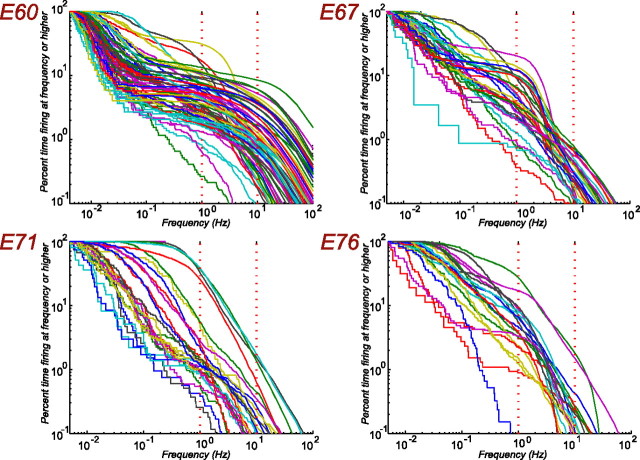
Figure 7.
Distribution of cells firing at a particular rate or higher. For each developmental age, the percentage of time firing at a given frequency or higher is plotted as a function of firing frequency. Each curve within a plot is a different cell. The red dotted vertical reference lines are for 1 and 10 Hz firing frequencies. Note that the distinctive plateaus seen in the E60 plot are attributable to the long silent intervals between bursts attributable to a wave.

