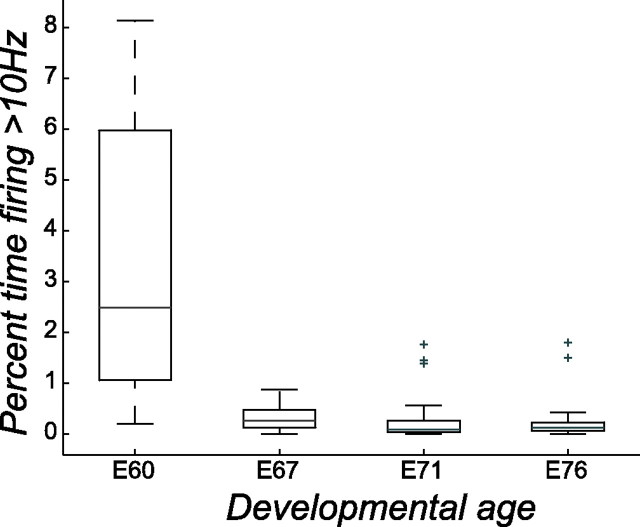
Figure 8.
Percentage of time firing at 10 Hz or higher as a function of developmental age. For each age in Figure 7, the distribution of times spent firing at 10 Hz or above is plotted as a box plot. The box has lines at the lower quartile, median, and upper quartile values. The whiskers are lines extending from each end of the box to show the extent of the rest of the data. Outliers (+) are data with values beyond the ends of the whiskers. Median values for E60, E67, E71, and E76 are 2.5, 0.3, 0.1, and 0.1%, respectively.

